Analytics
Analytics, also referred to as Scanners, provides crucial data based on market studies. It aids investors and traders in identifying patterns, forecasting future movements, assessing risks, and refining trading strategies.
On the Web
Click on Analytics in the menu bar to access the Analytics section.
Users can find the following features:
Result’s Calendar
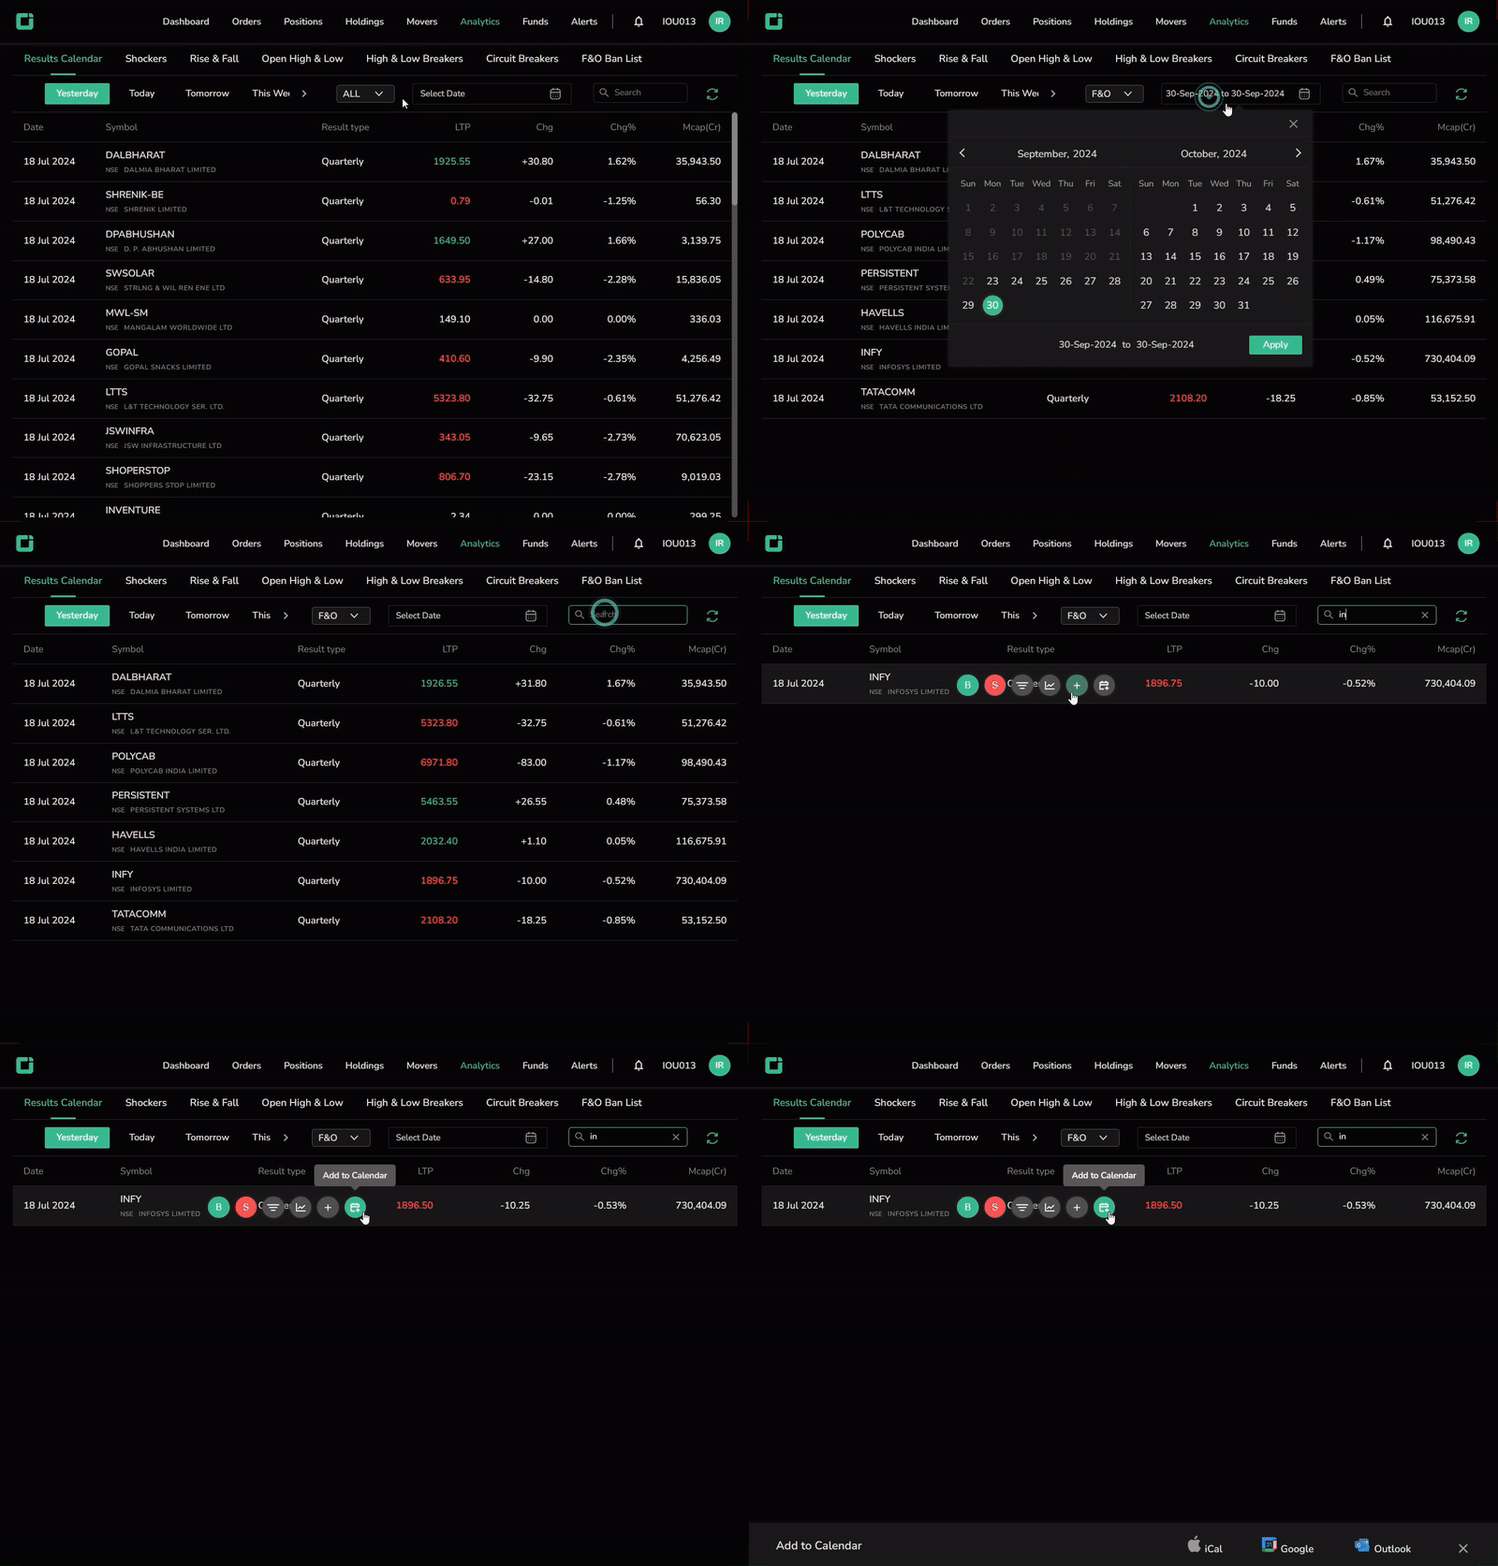
The Result’s Calendar displays the dates when publicly traded companies are scheduled to release their financial results, such as quarterly earnings or annual performance reports.
Users can sort data by Yesterday, Today, Tomorrow and This Week, and customize the view for either All stocks or just F&O. There’s also a search option to look up specific symbols.
Shockers
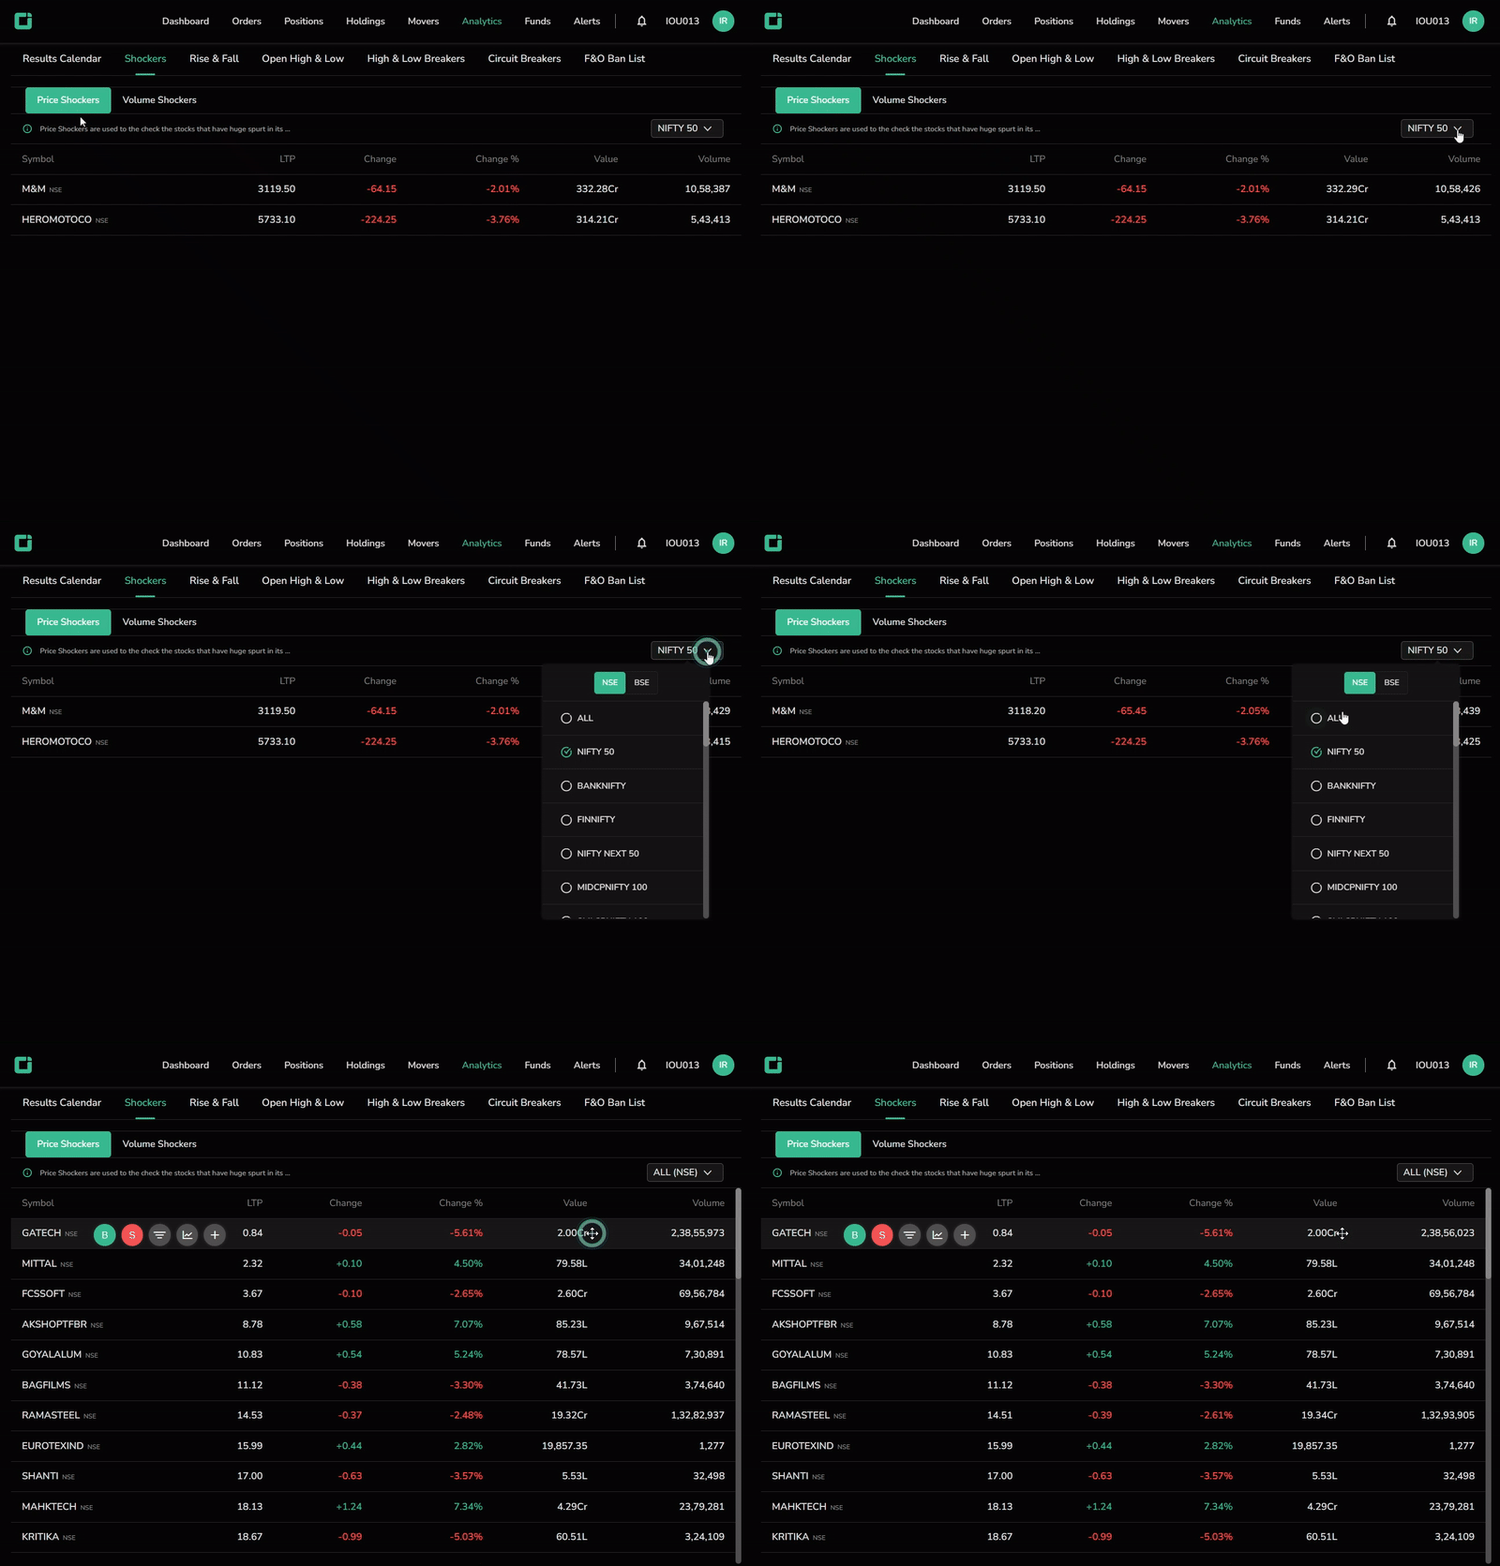
Shockers highlight stocks that have experienced a significant surge in their share price or volume over the last 10 days.
Users can choose to view price or volume shockers for a specific index or across all indices.
Rise & Fall
The Rise & Fall feature tracks short-term trends in stocks.
- The ‘Volume Up Price Up’ signal indicates growing buyer interest, with both volume and price moving upwards.
- The ‘Volume Up Price Down’ signal suggests increasing selling pressure, leading to price declines.
Users can view this data for all indices or focus on a specific index.
Open High & Low
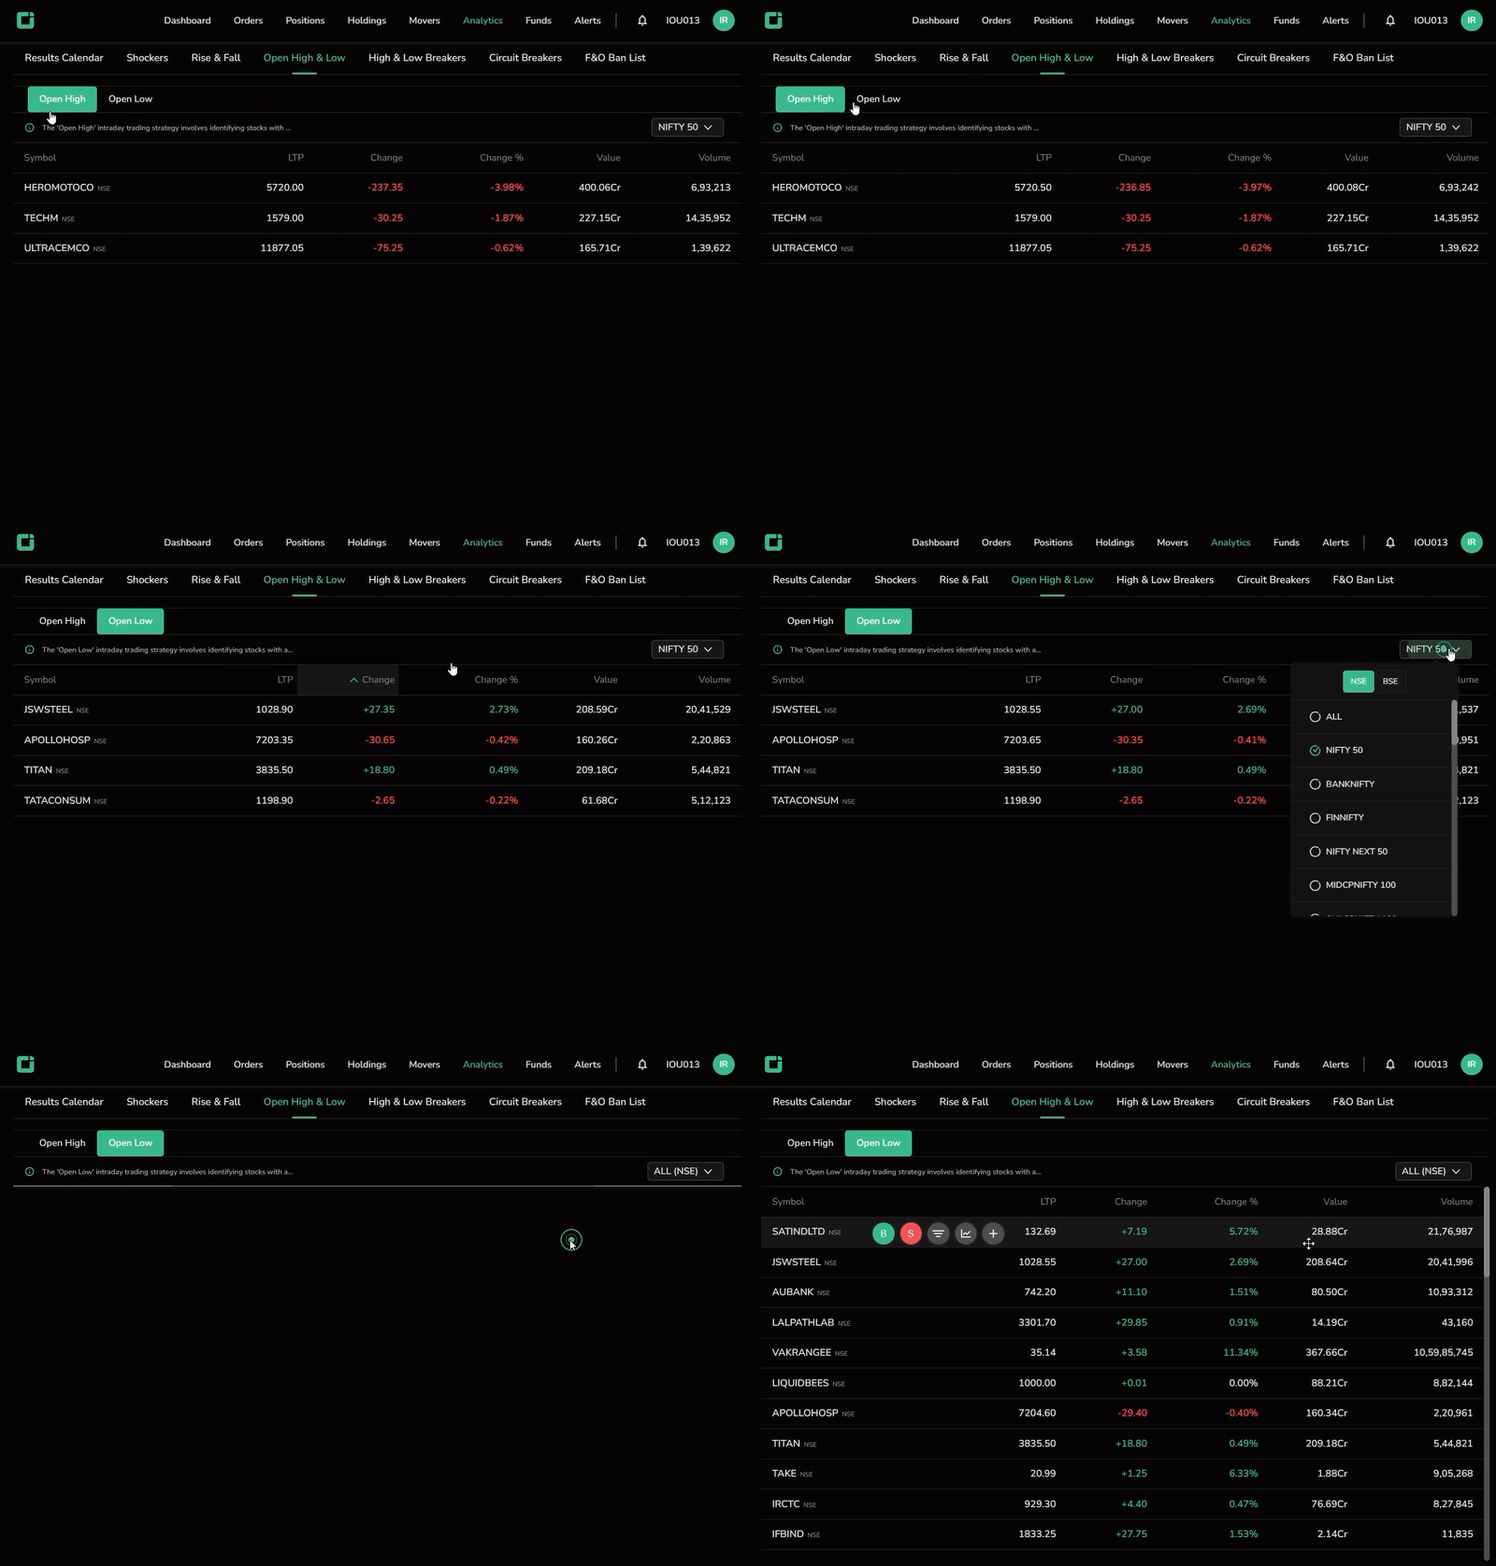
Open High/Low signals bearish sentiment when the opening price matches the day’s highest price and bullish momentum when the opening price matches the lowest.
Users can toggle between Open High and Open Low and view data for specific indices or all indices.
High & Low Breakers
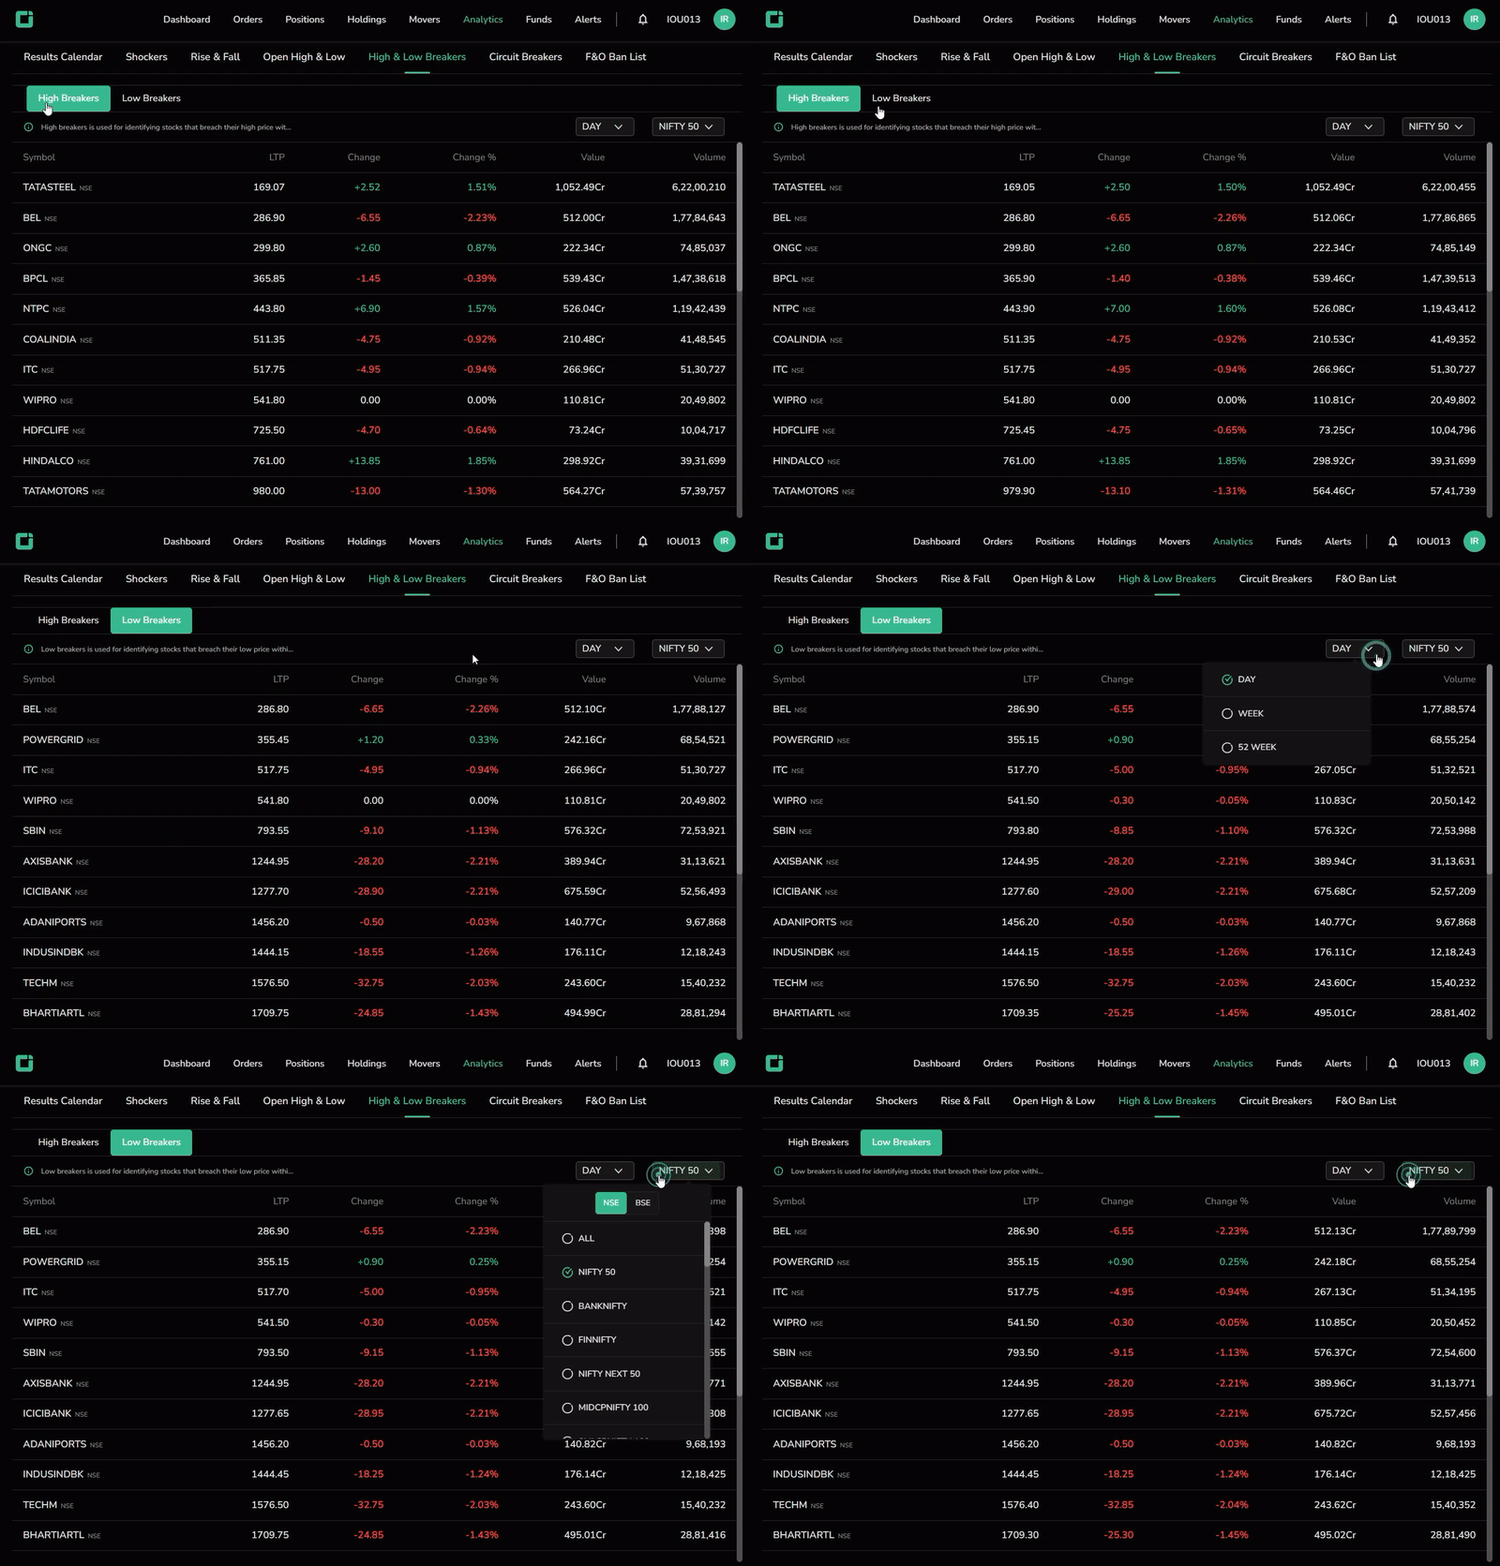
- High Breakers identify stocks that surpass their previous high price within a given timeframe, signaling upward momentum.
- Low Breakers, on the other hand, flag stocks falling below their prior low, indicating potential downward movement.
Users can adjust the timeframe to day, week, or 52-week and filter by individual or all indices.
Circuit Breakers
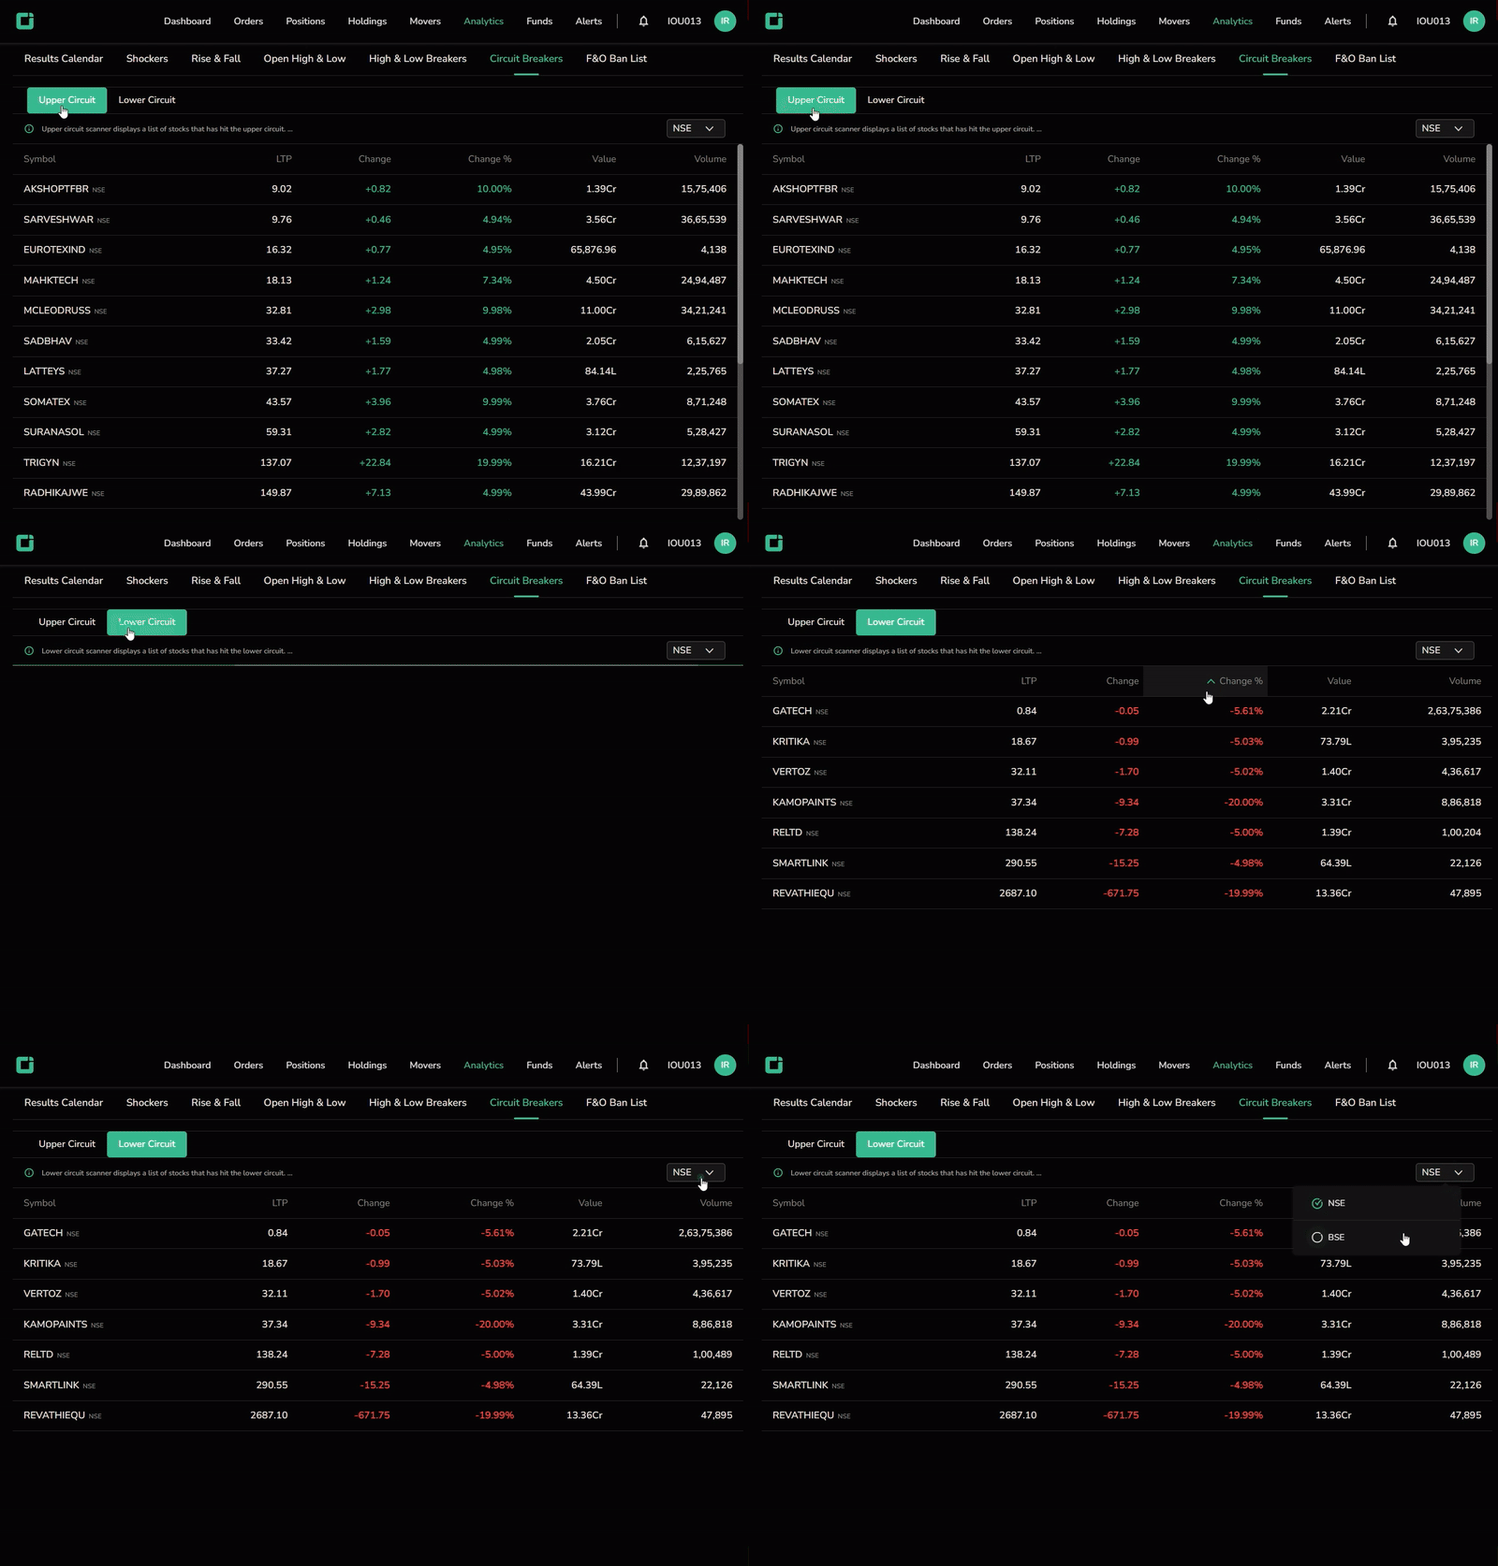
Circuit Breakers are mechanisms designed to temporarily halt trading during excessive price movements, helping to prevent extreme volatility.
- The Upper Circuit Scanner highlights stocks that have hit their maximum price limit for the day, often signaling strong buying interest and profit potential.
- The Lower Circuit Scanner identifies stocks that have reached their minimum price limit, typically reflecting heavy selling pressure.
Users can switch between NSE and BSE data.
F&O Ban List
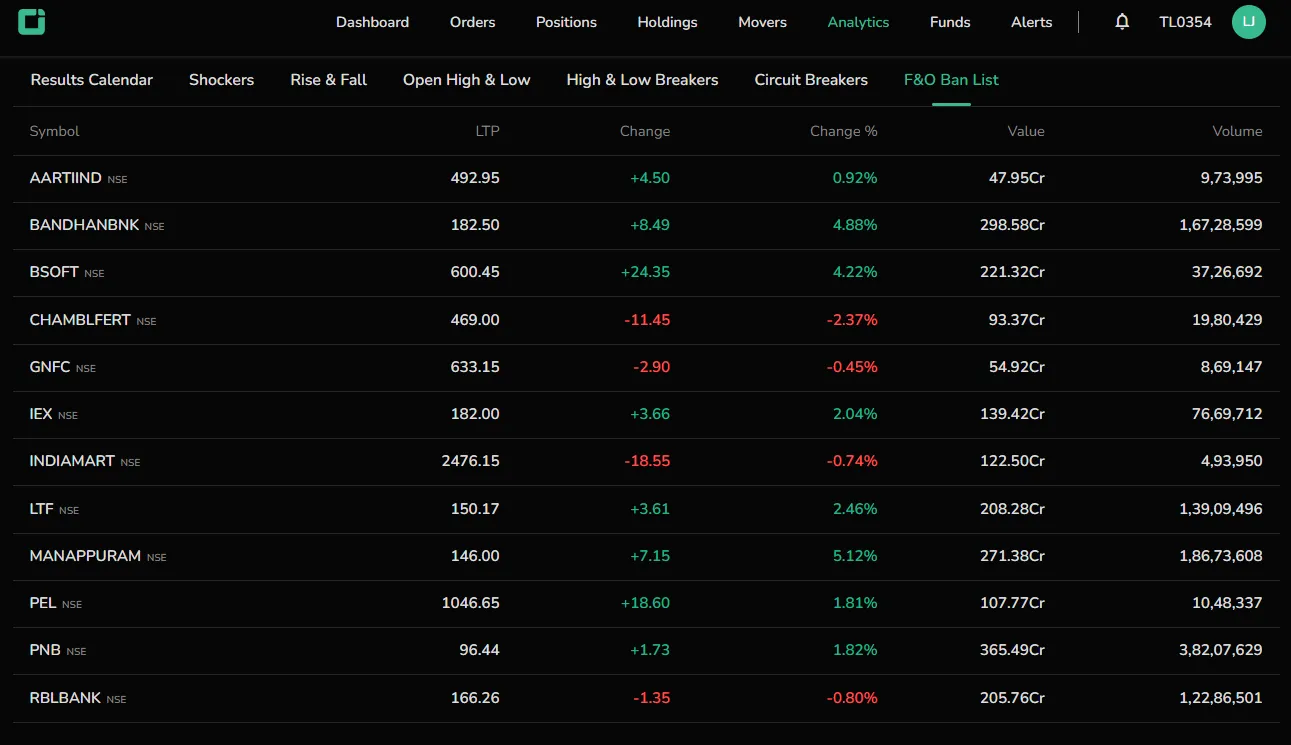
Displays the list of derivative contracts which are currently in Ban Period. The F&O contracts of stock enter the ban period when the open interest of any stock crosses 95% of the Market Wide Positions Limits (MWPL). The ban is lifted once the open interest falls below 80%.
On the Mobile
Click on the “Products” in the bottom menu bar and select Analytics

Results Calendar has more sorting options on the timeframe like:
- Yesterday
- Today
- Tomorrow
- This Week
- Next Week
