Financials
Financials or Fundamentals are essential financial data and metrics used to evaluate a company’s health, profitability, and growth potential. These include financial statements and ratios that offer insights into the company’s performance and future prospects.
Financials are available only for equity.
On the Web
Navigate to Financials from the Quotes Page.
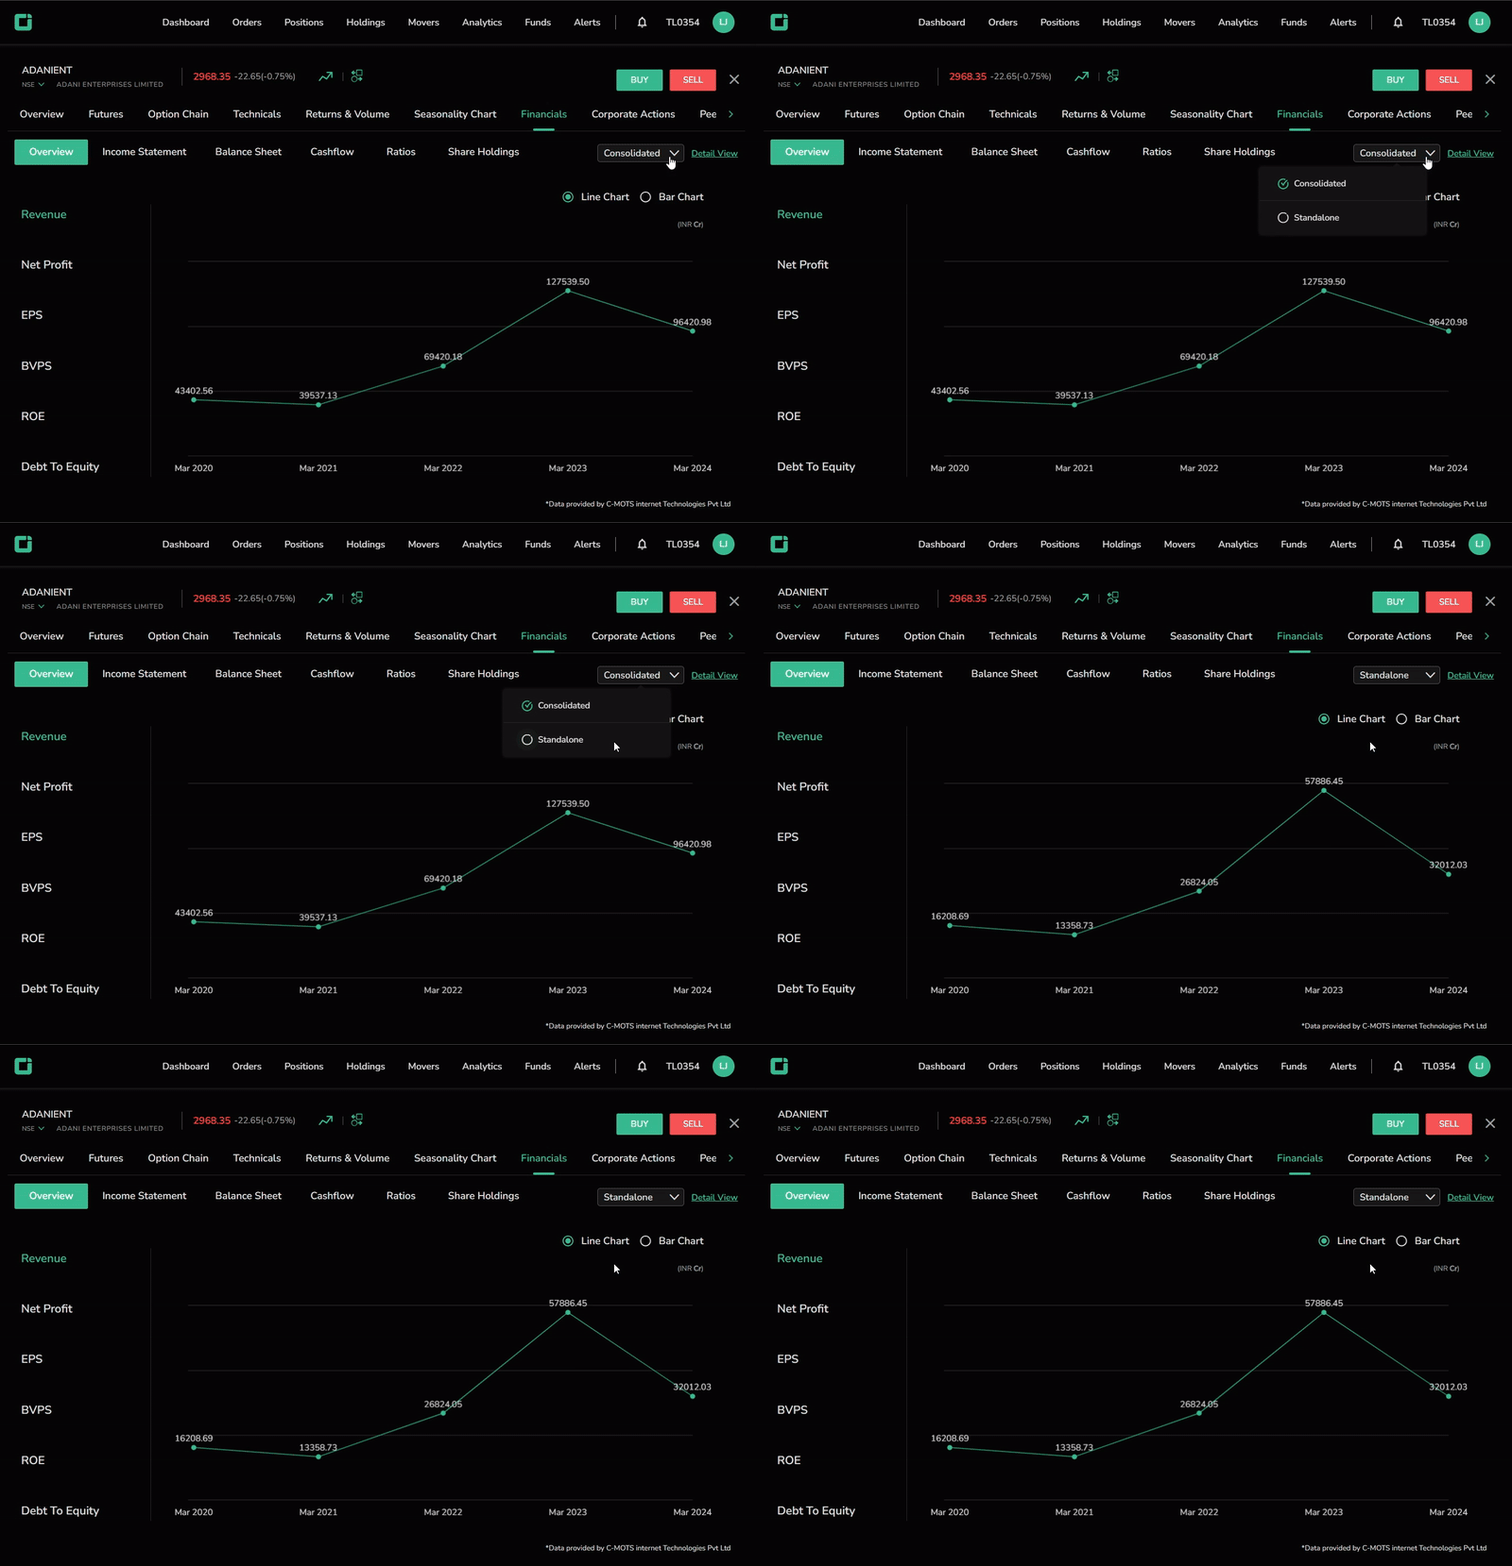
Overview
View key financial indicators like:
- Revenue
- Net Profit
- EPS
- BVPS
- ROE
- Debt to Equity
Switch between consolidated and standalone views, with data available for the past five years. Customize the view by choosing between line and bar charts.
Income Statement
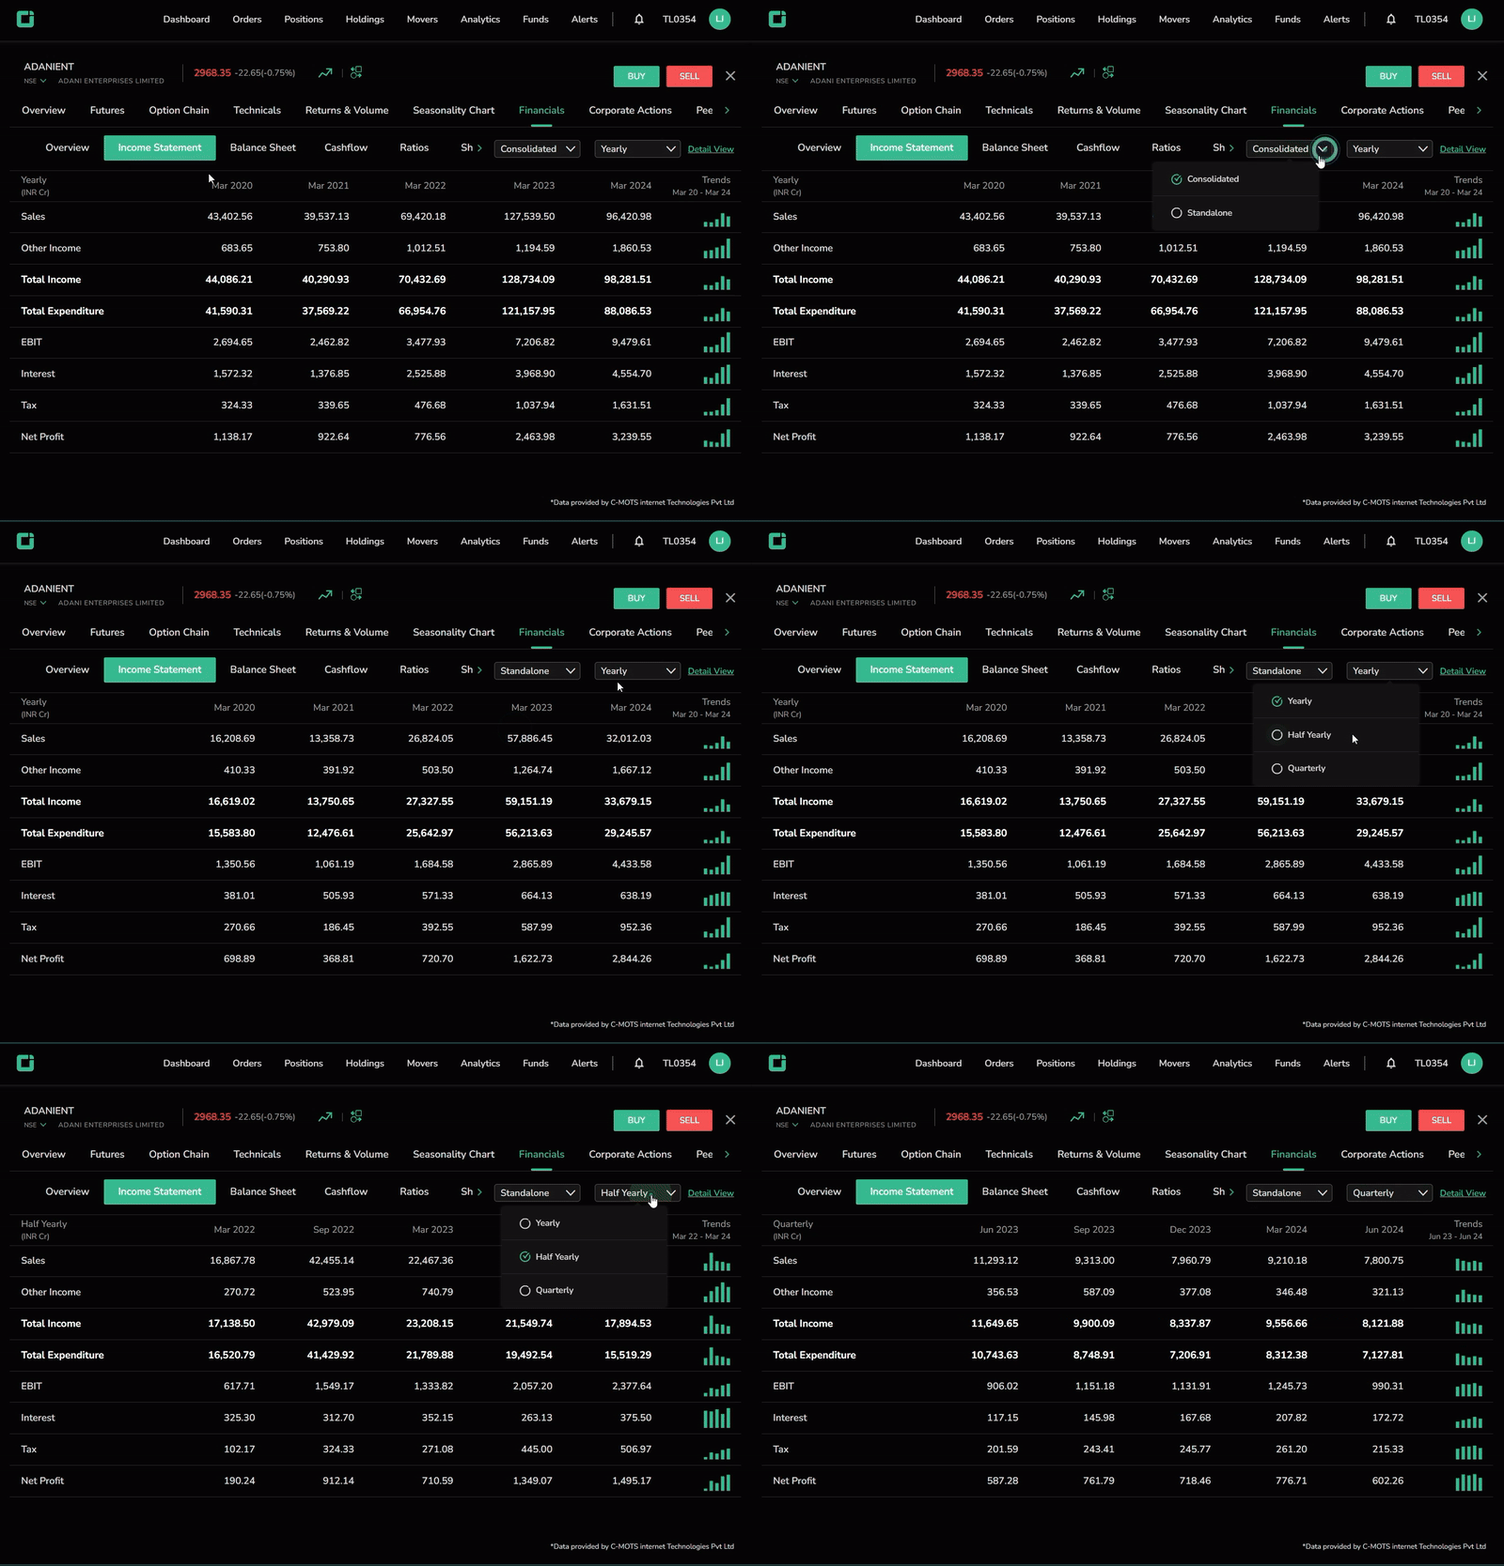
View details such as:
- Sales
- Other Income
- Total Income
- Total Expenditure
- EBIT
- Interest
- Tax
- Net Profit
A bar graph represents the overall trends over the past five years, with positive results in green and negative in red. Switch between consolidated and standalone data, and customize results for yearly, half-yearly, and quarterly data.
Balance Sheet
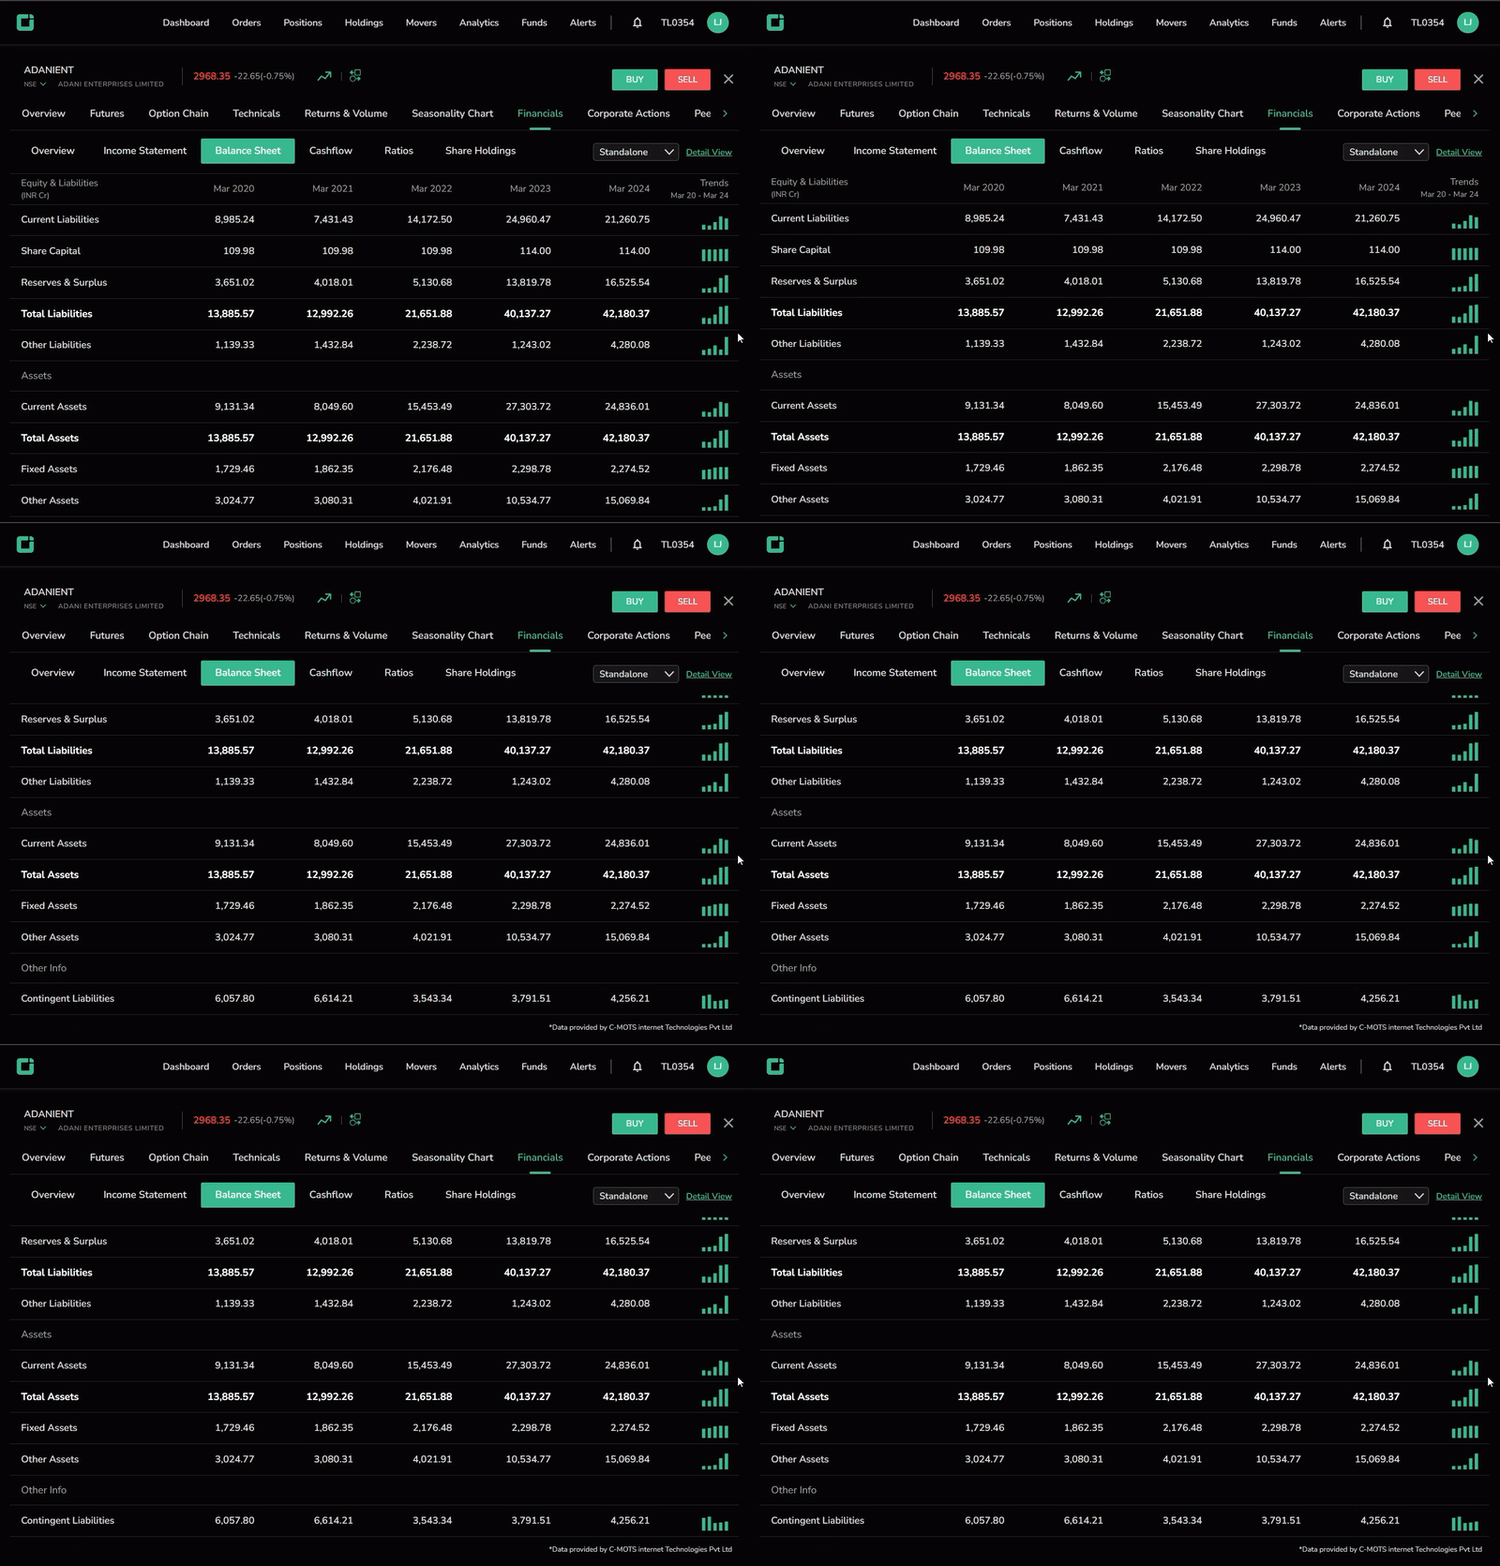
The balance sheet provides a snapshot of a company’s assets, liabilities, and shareholders' equity. Users can switch between consolidated and standalone data.
Under liabilities, find:
- Current Liabilities
- Share Capital
- Reserves & Surplus
- Total Liabilities
- Other Liabilities
Under assets, find:
- Current Assets
- Total Assets
- Fixed Assets
- Other Assets
A bar graph in the table illustrates the results for the past five years in green and red color bars.
Cashflows
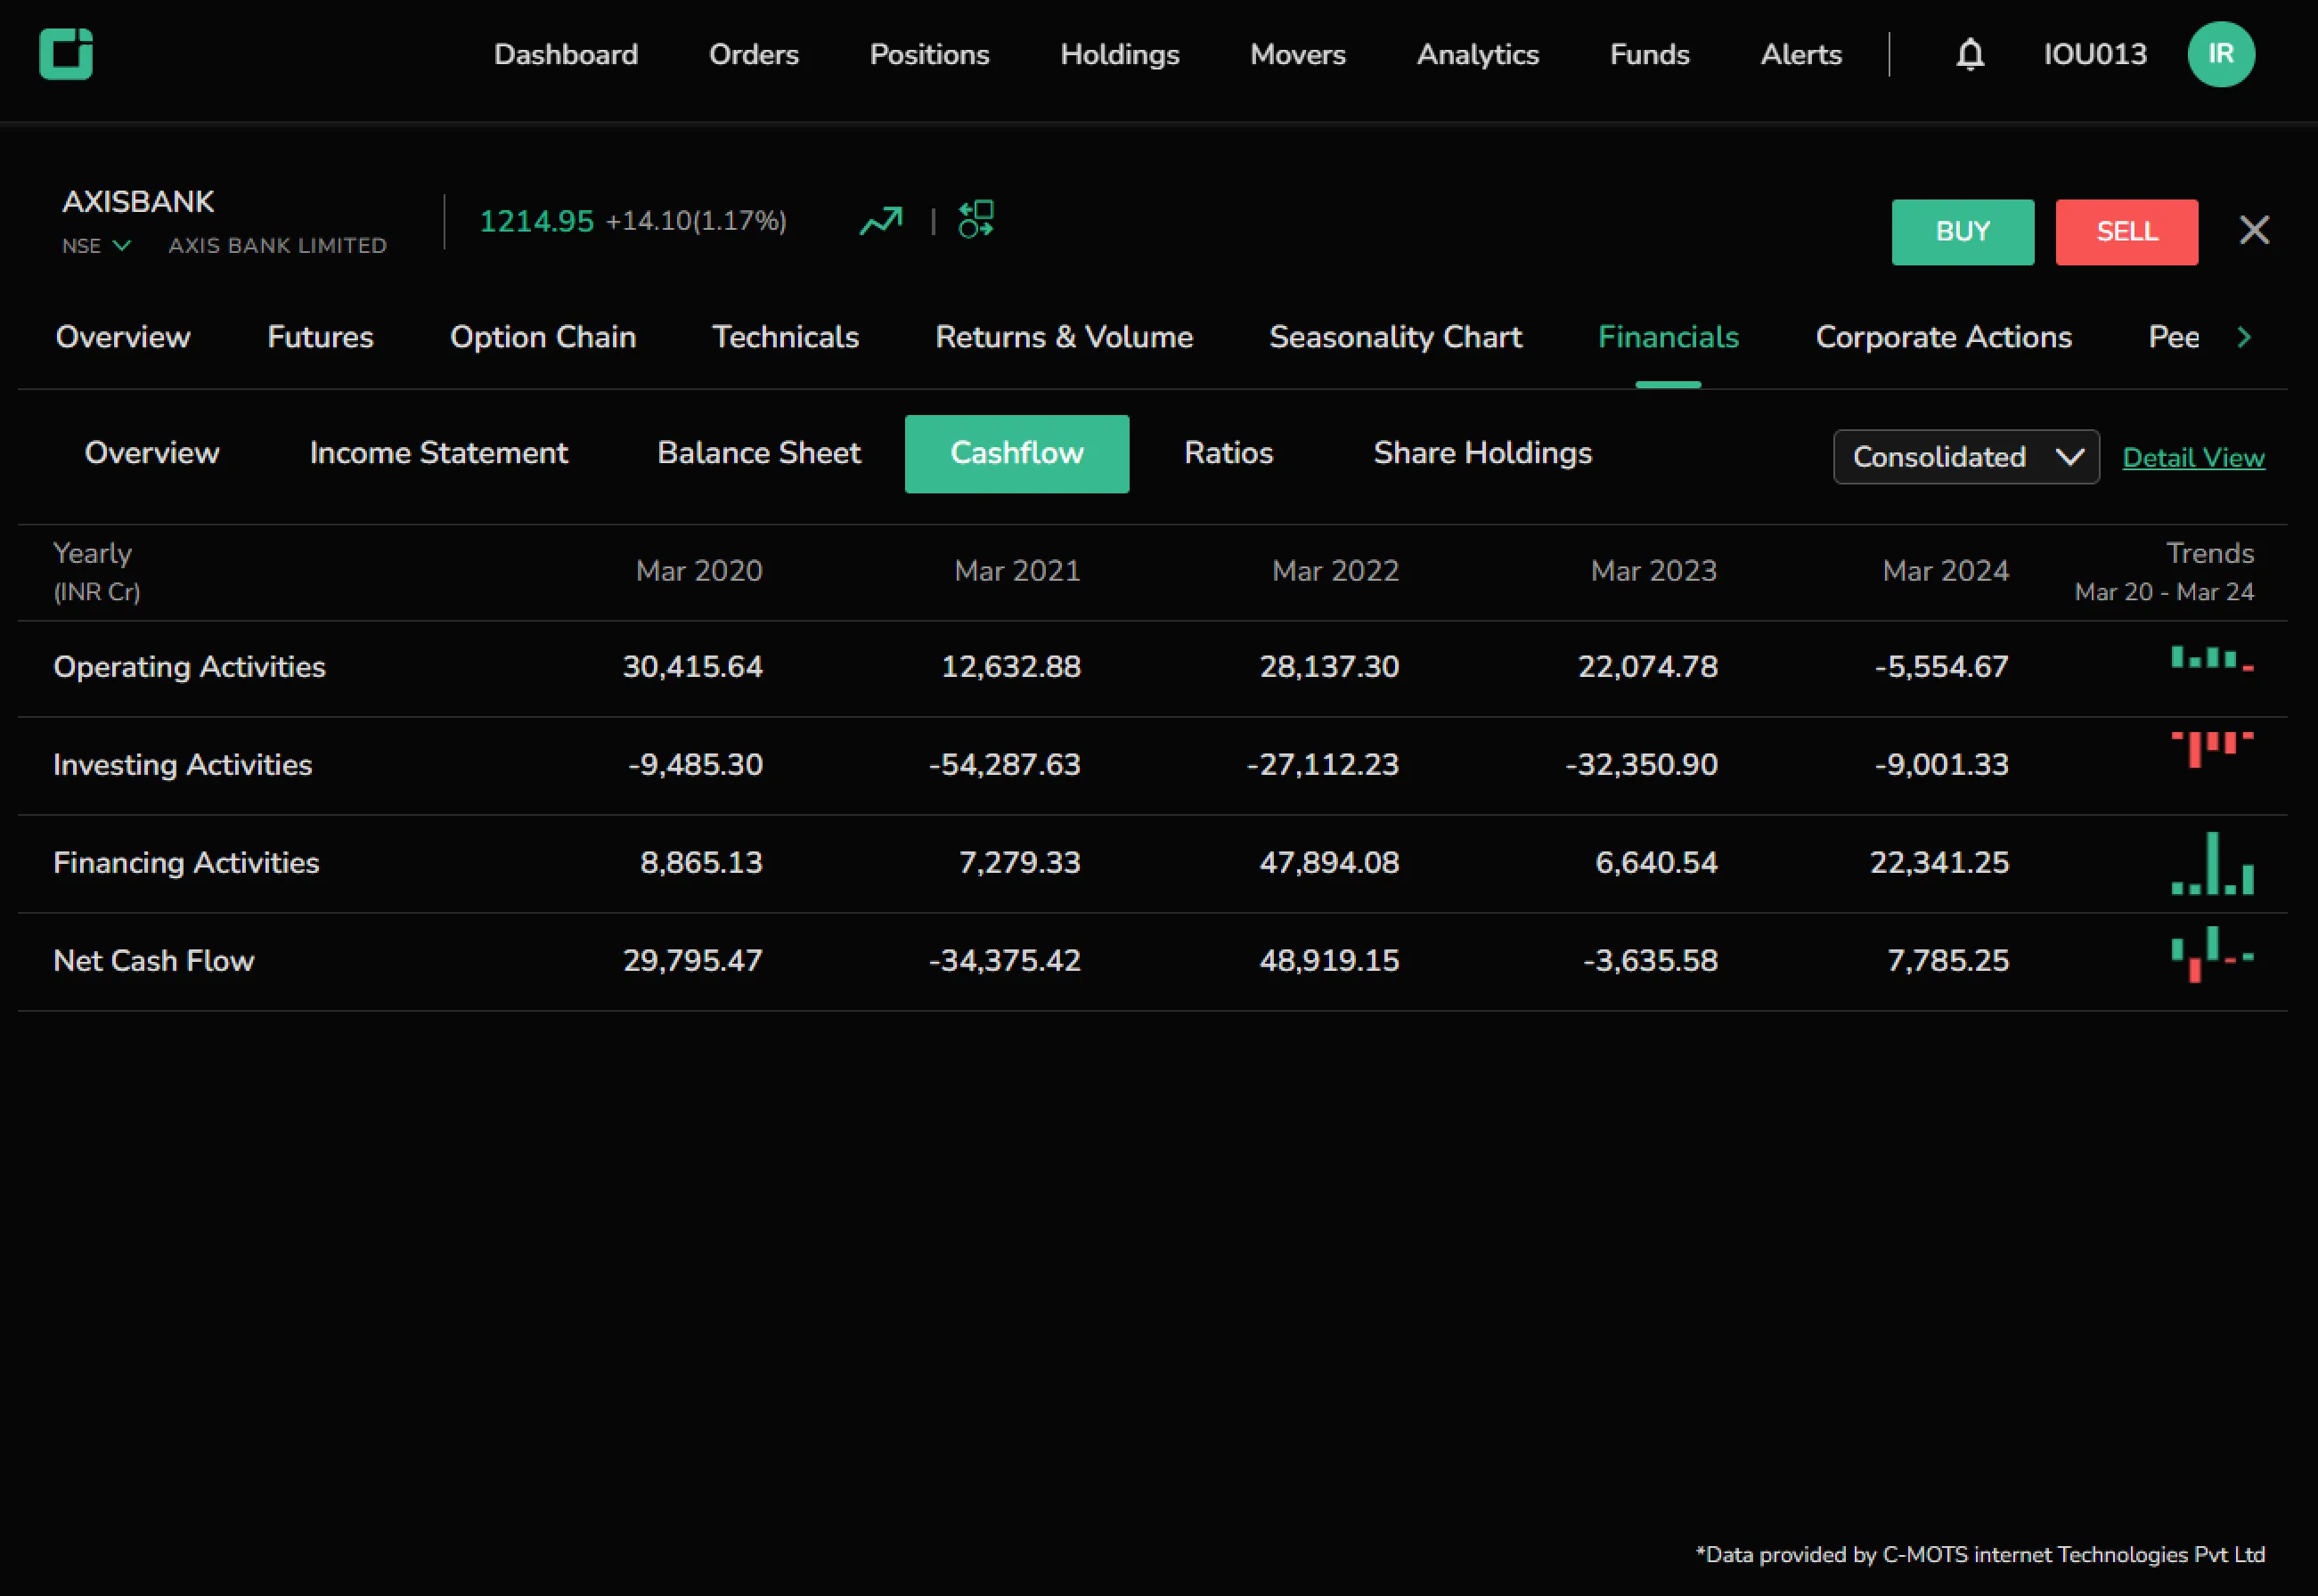
Cashflows show the movement of money over the past five years across:
- Operating Activities
- Investing Activities
- Financing Activities
- Net Cash Flow
A mini bar chart at the end represents trends for the last five years in a graphical format.
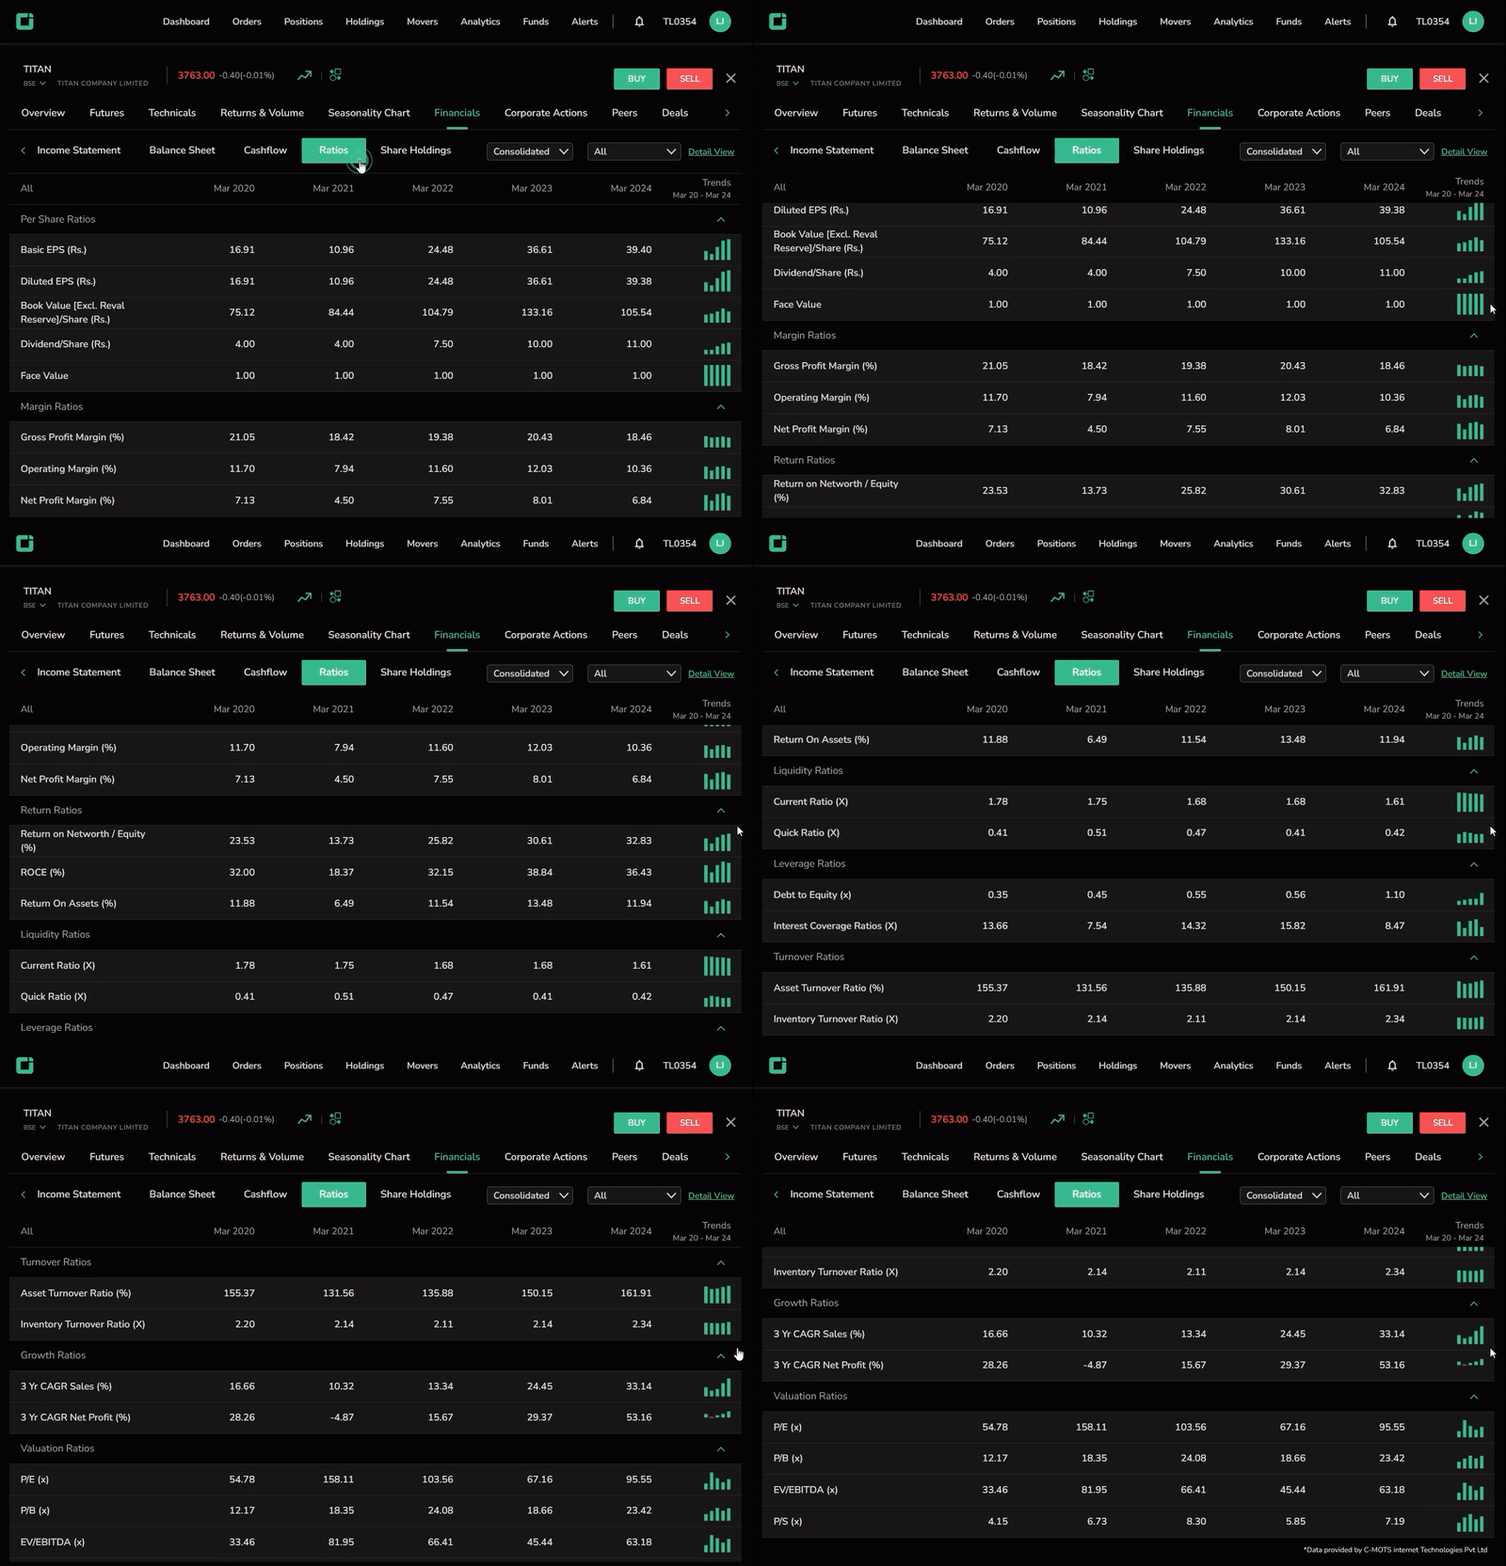
Ratios
Ratios are quantitative measures of a company’s financial health, performance, and valuation.
Users can explore per share, margin, return, liquidity, leverage, turnover, growth, and valuation ratios over five years. A dropdown allows selection of specific ratios. Switch between consolidated and standalone data.
Shareholding
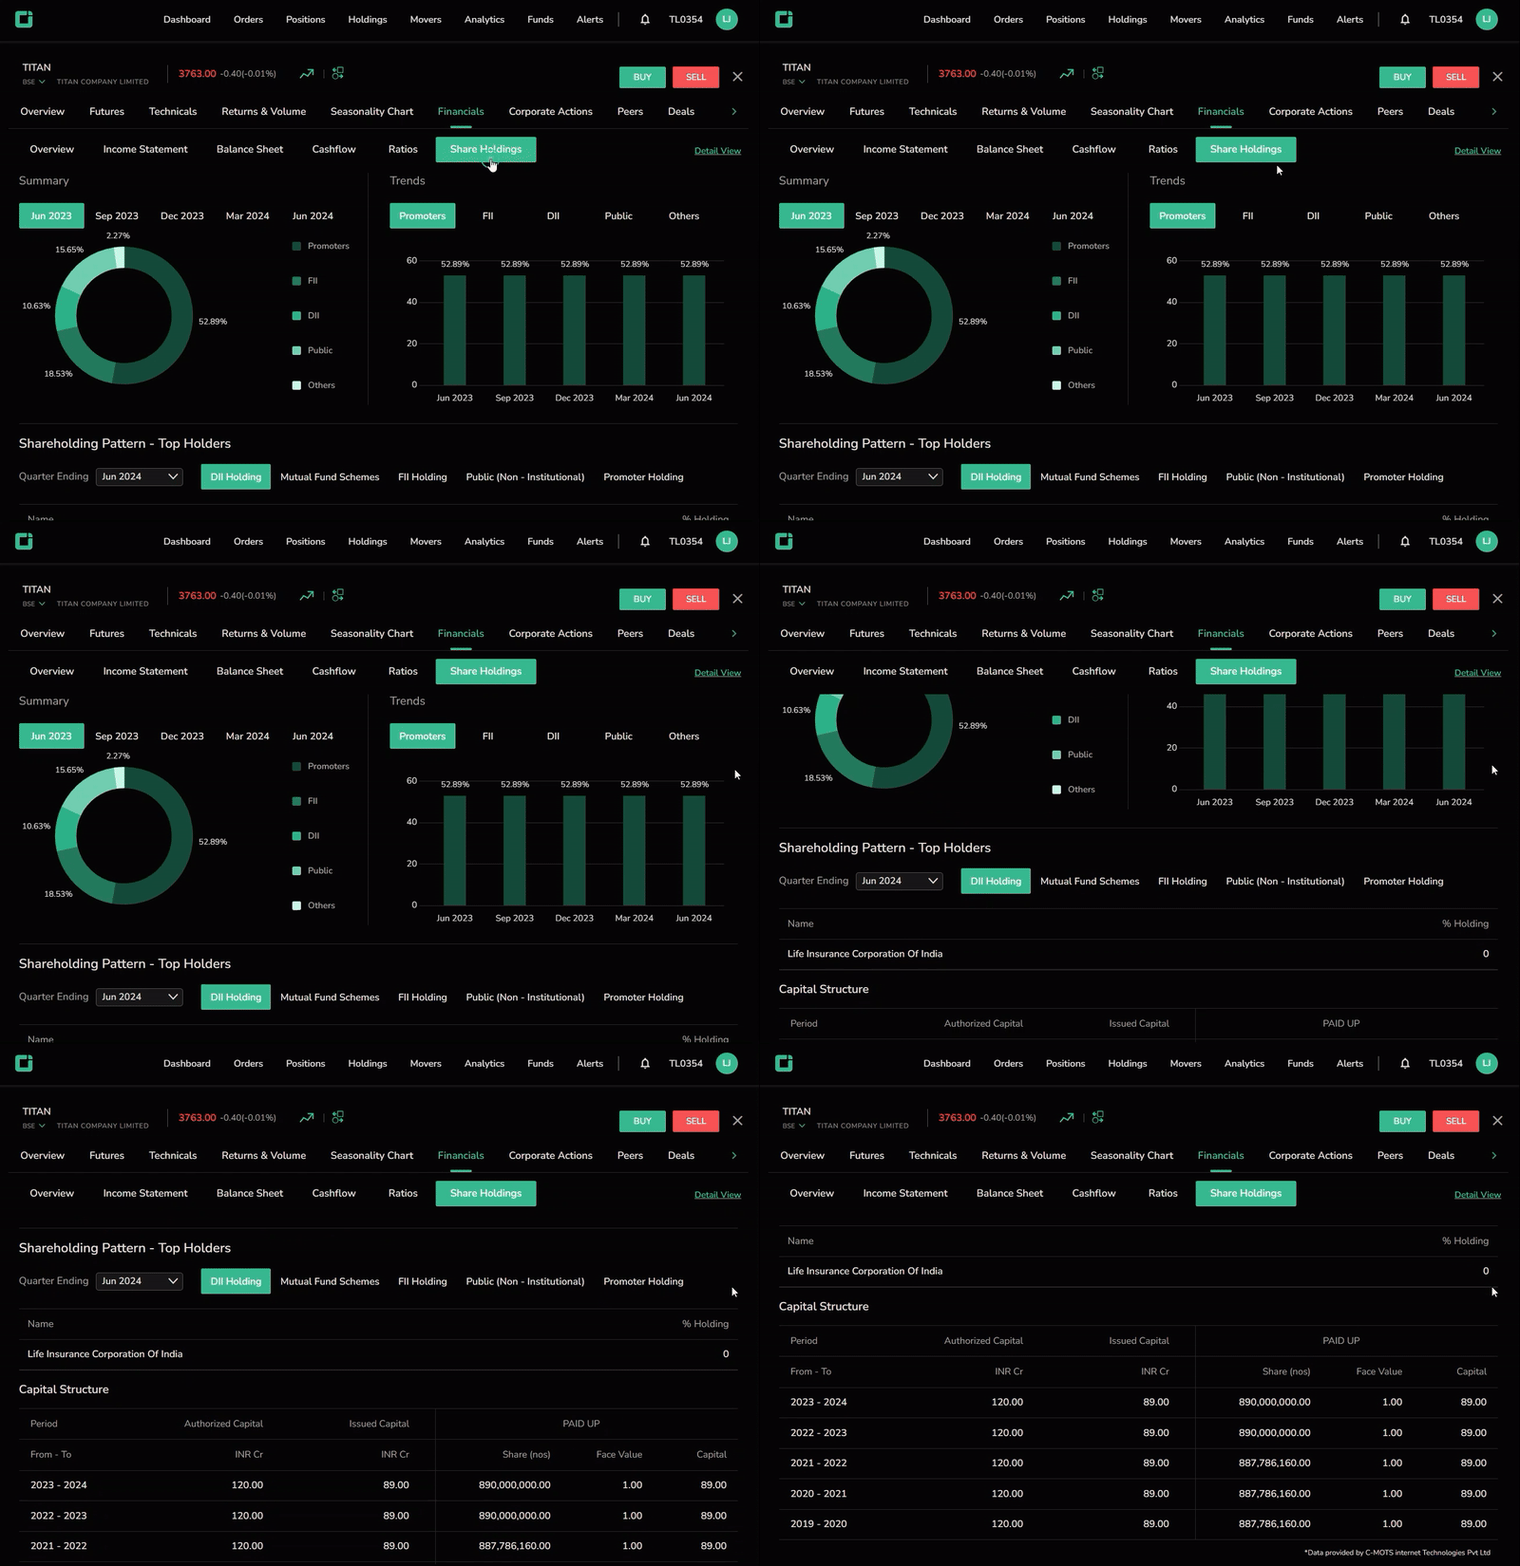
In CubePlus, shareholding is segmented into:
- Promoters
- FII
- DII
- Public
- Others
Explore trends within each category, and view top holders’ data for the quarter.
Fundamentals Detailed View
Click on the Detail View in Financials to access the Fundamentals Detailed View, which provides ten years of data.
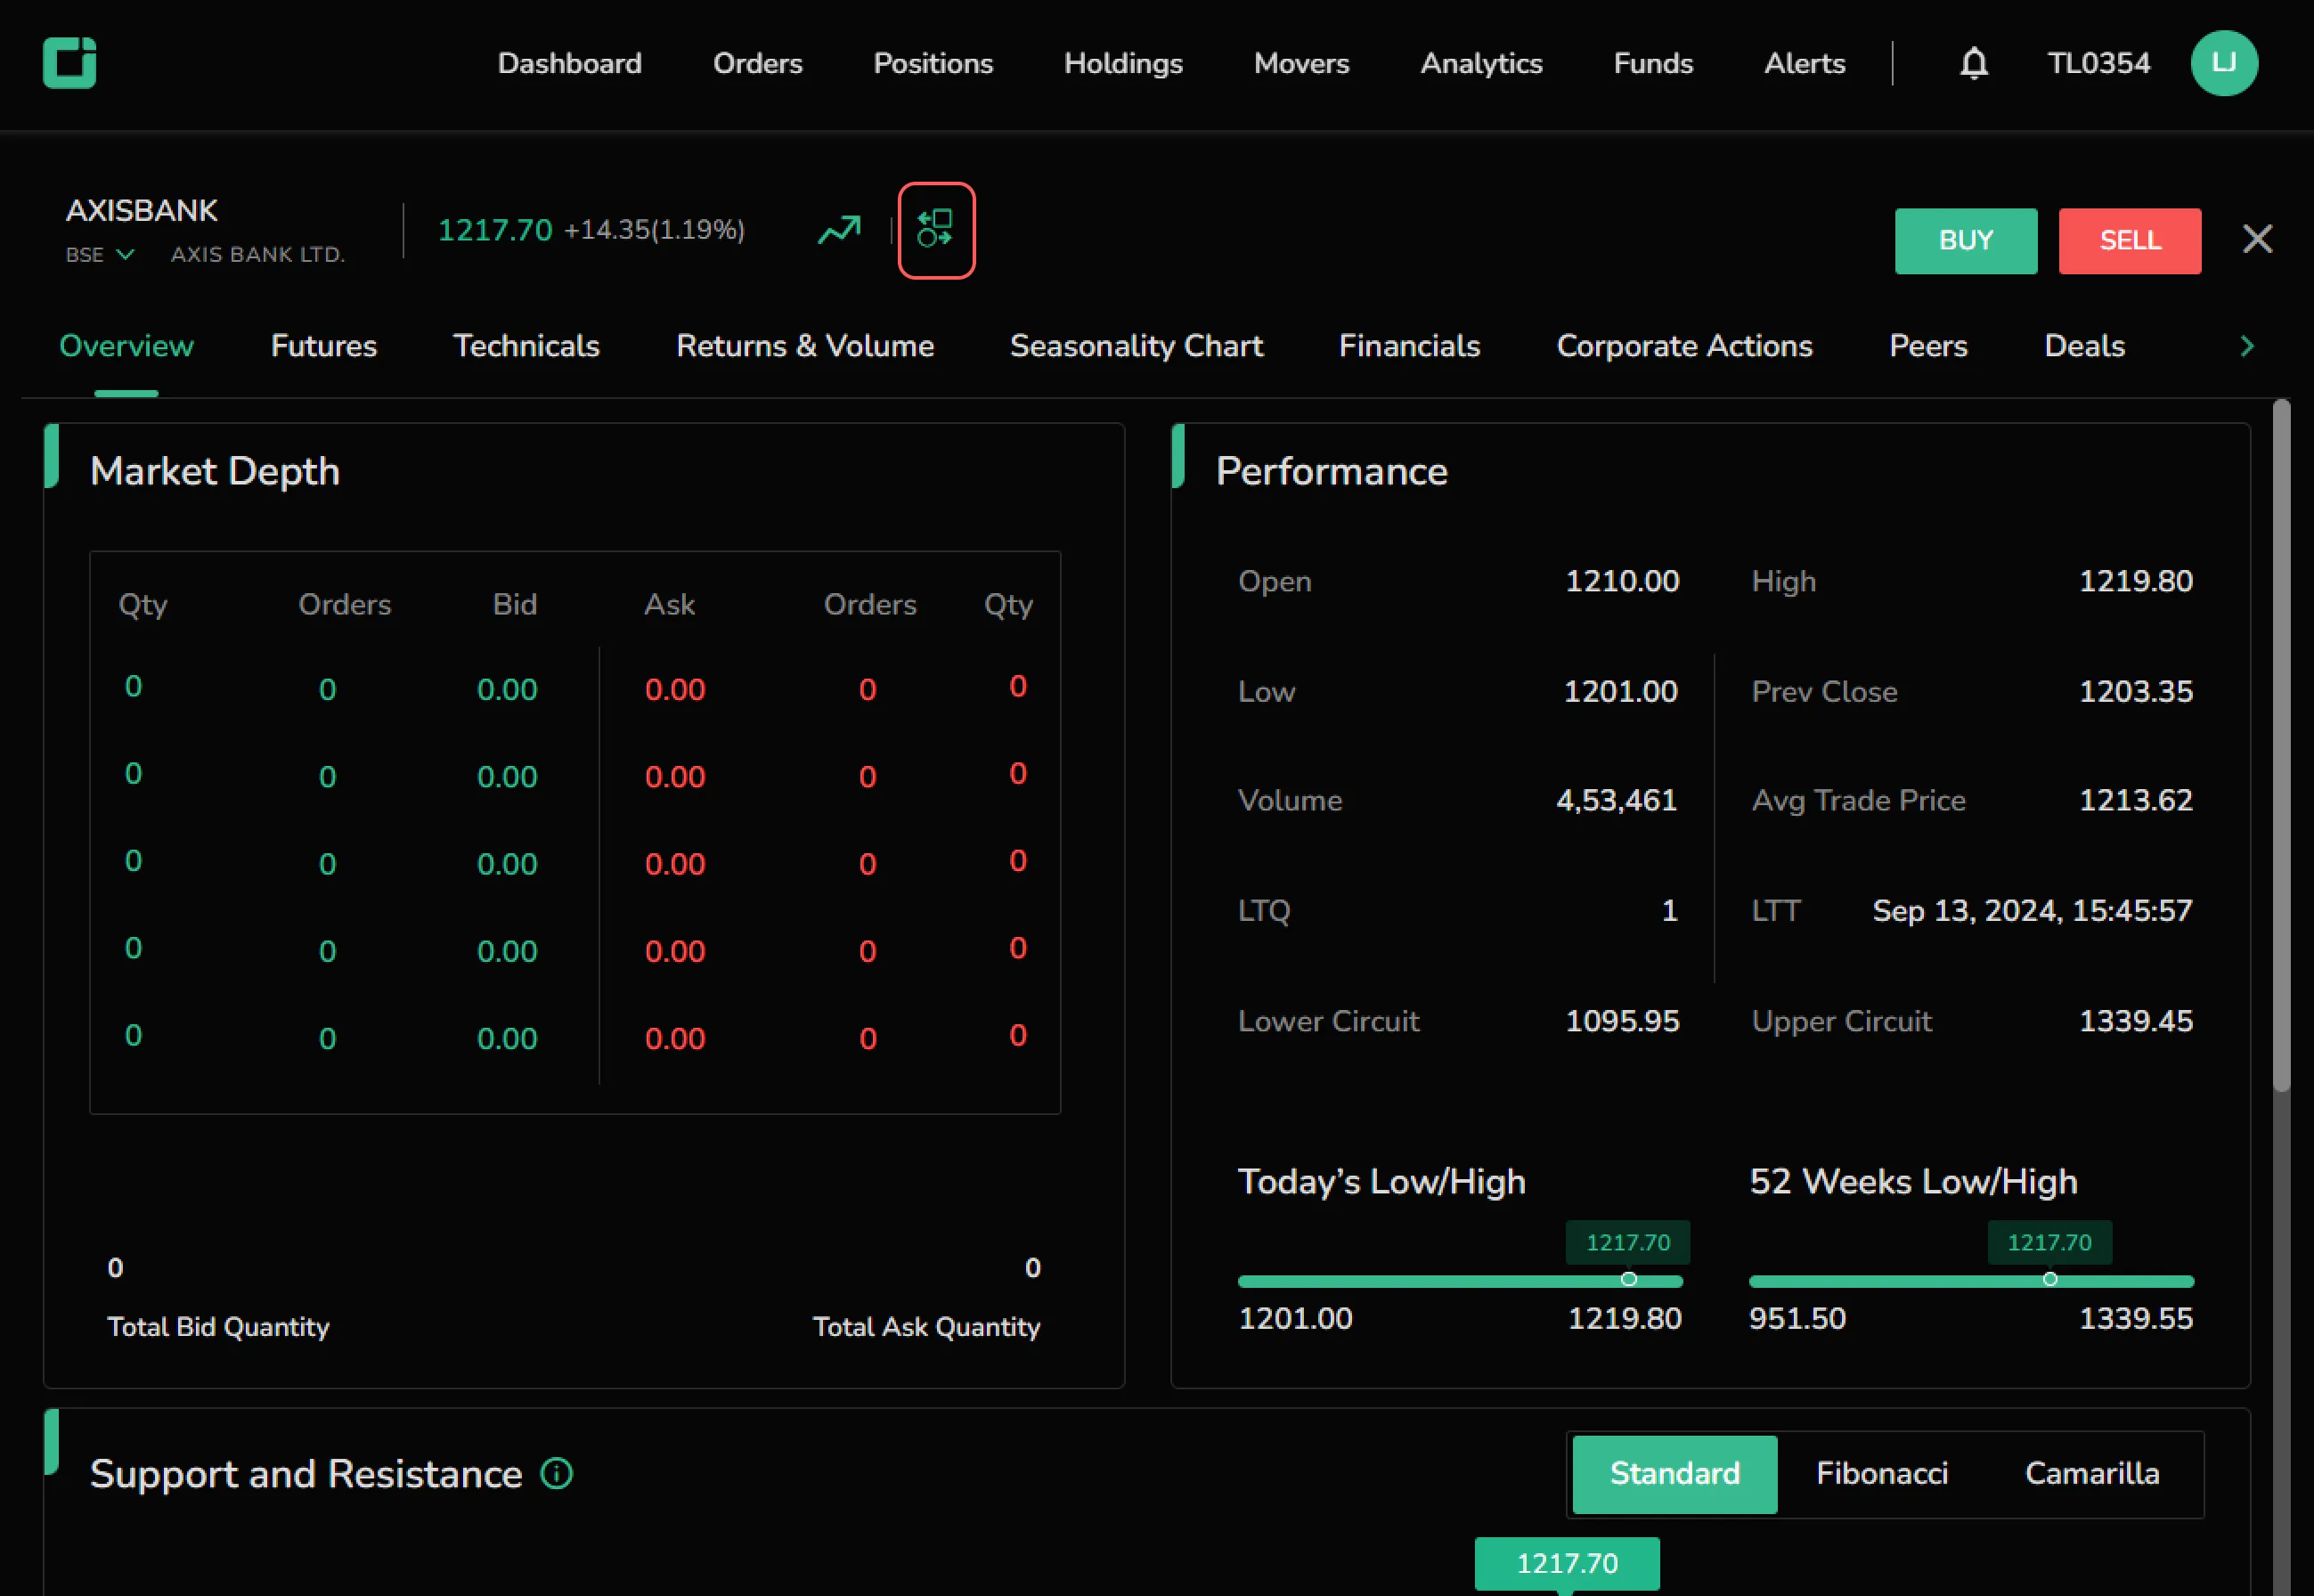
The Fundamentals Detailed View carries the official website link of the stock.
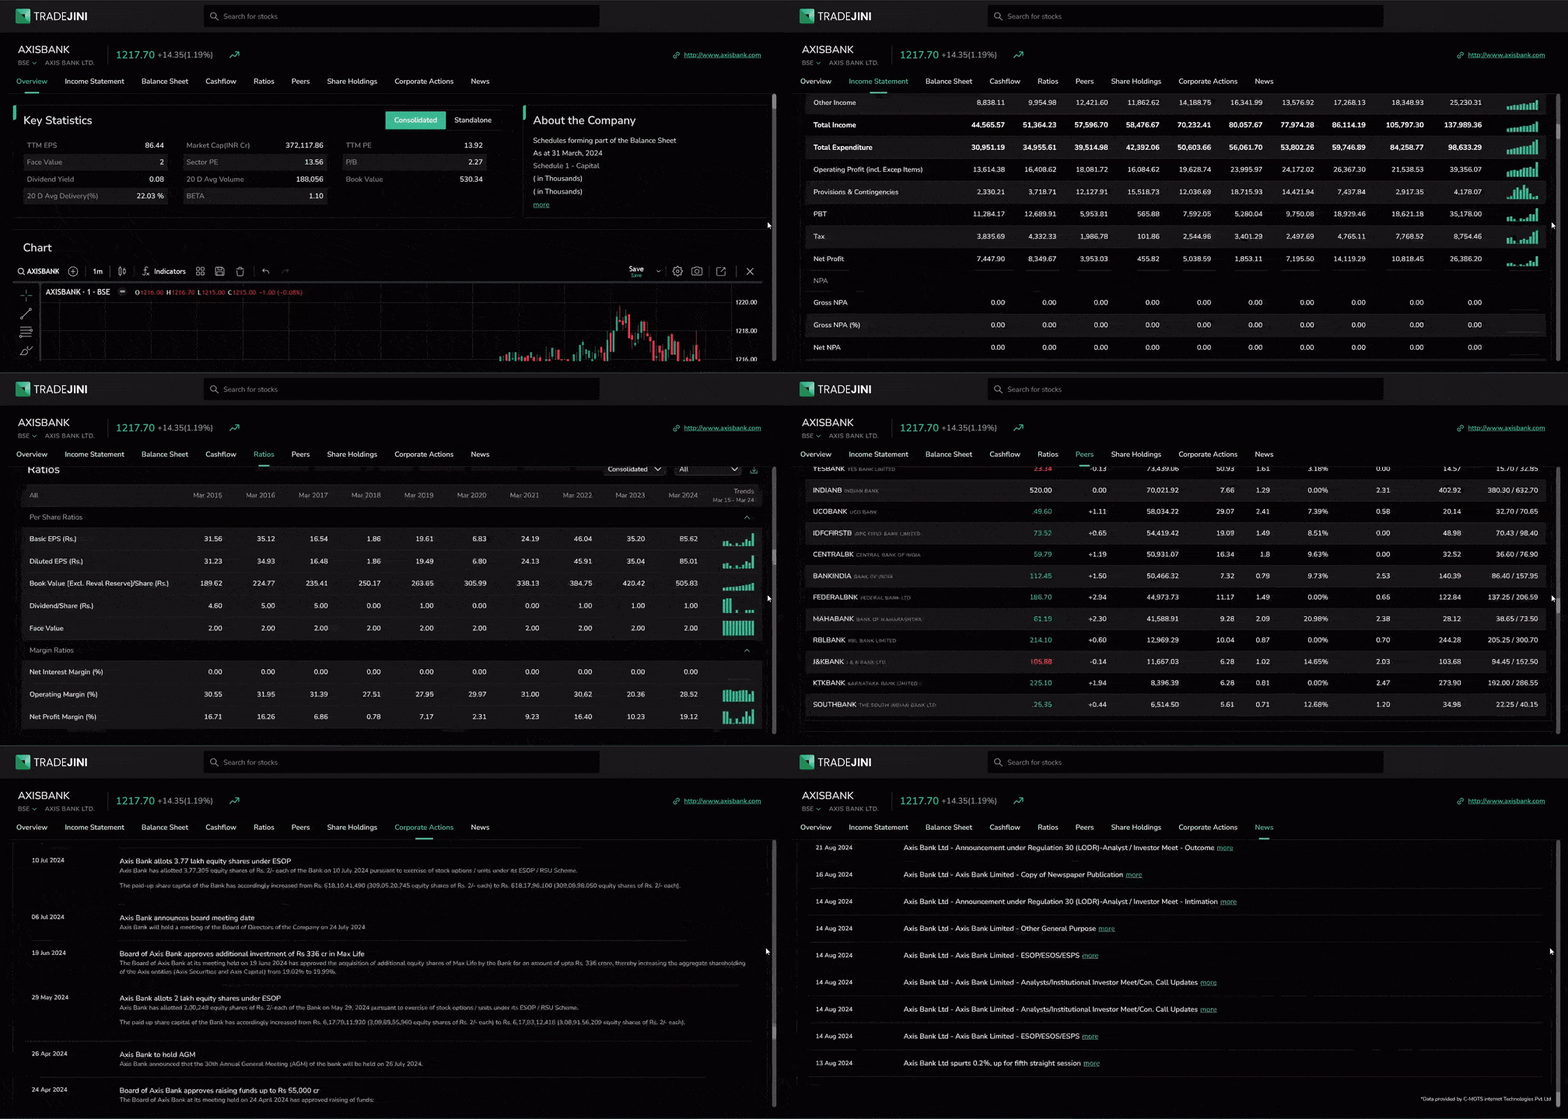
Users can switch between Consolidated and Standalone data to customize their view on Key Statistics.
This section includes income statements, balance sheets, cashflows, ratios, and shareholdings. Users can download data directly from the interface.
Besides, corporate actions, peers, and news are also available in the Detailed View with ten years data.
On the Mobile
Click on the stock name in the Marketwatch. Scroll down to the quote overview and click on Fundamentals. The mobile view includes:
- Key statistics
- Financials
- Corporate actions
- Peers
- Deals
- News
- Info
