Technicals
On the Web
Technical analysis is a method used by traders to evaluate price trends and patterns to identify potential investment and trading opportunities. By analyzing past trading activity and price changes, technical analysts aim to predict future price movements of securities.
This approach relies on historical data, with traders using charts to spot trends and patterns. Technical analysis helps assess the value of a security, considering factors like volume and price movements.
It provides insights into market behavior, allowing traders to make informed decisions about when to enter or exit trades based on statistical trends and patterns.
Access Technicals
Navigate to Technicals from the Quotes page.
Summary
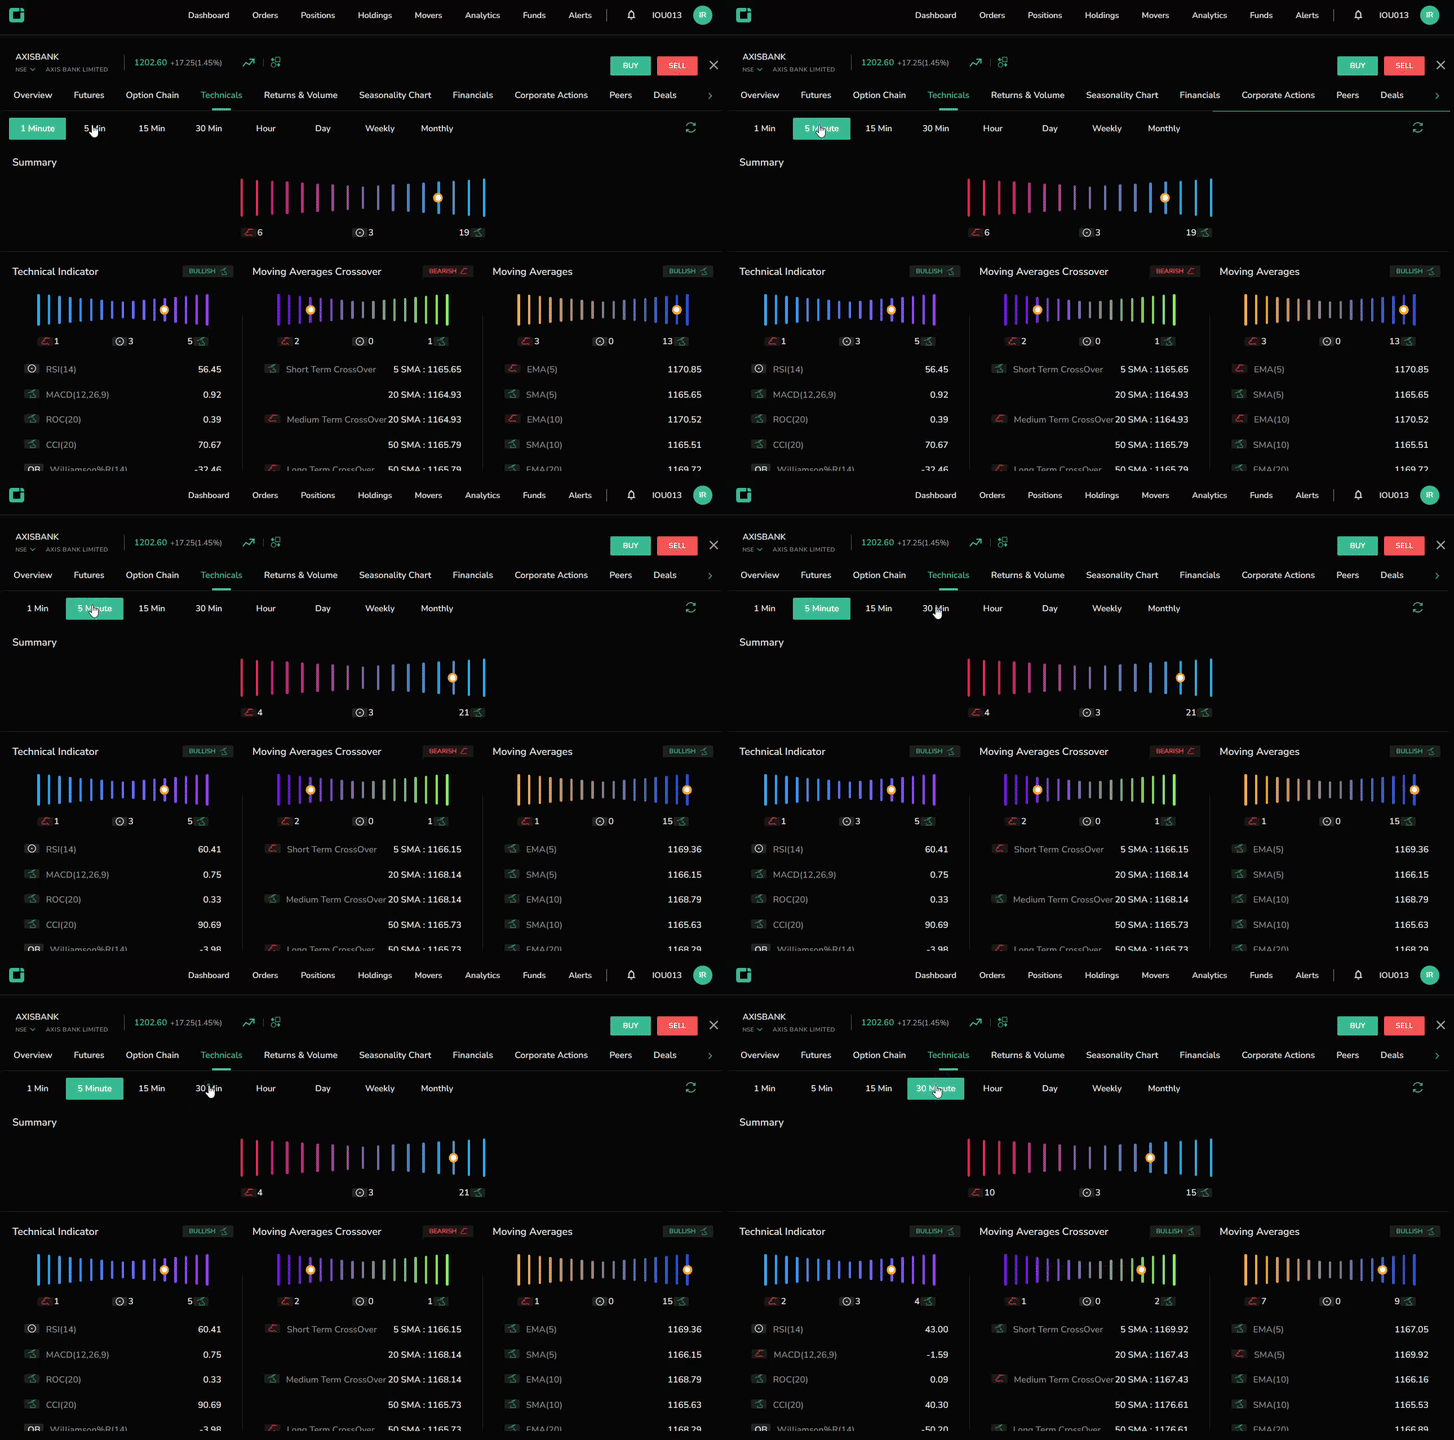
Find the sum of three major indicators, technical indicators, moving averages crossover, and moving averages, in the summary section. These indicators are visually represented with bull, neutral, and bear icons below, allowing users to easily see how many bulls, bears, and neutral signs are present to aid in trading decisions.
Customize the view by adjusting the time frame from 1 minute to 1 month.

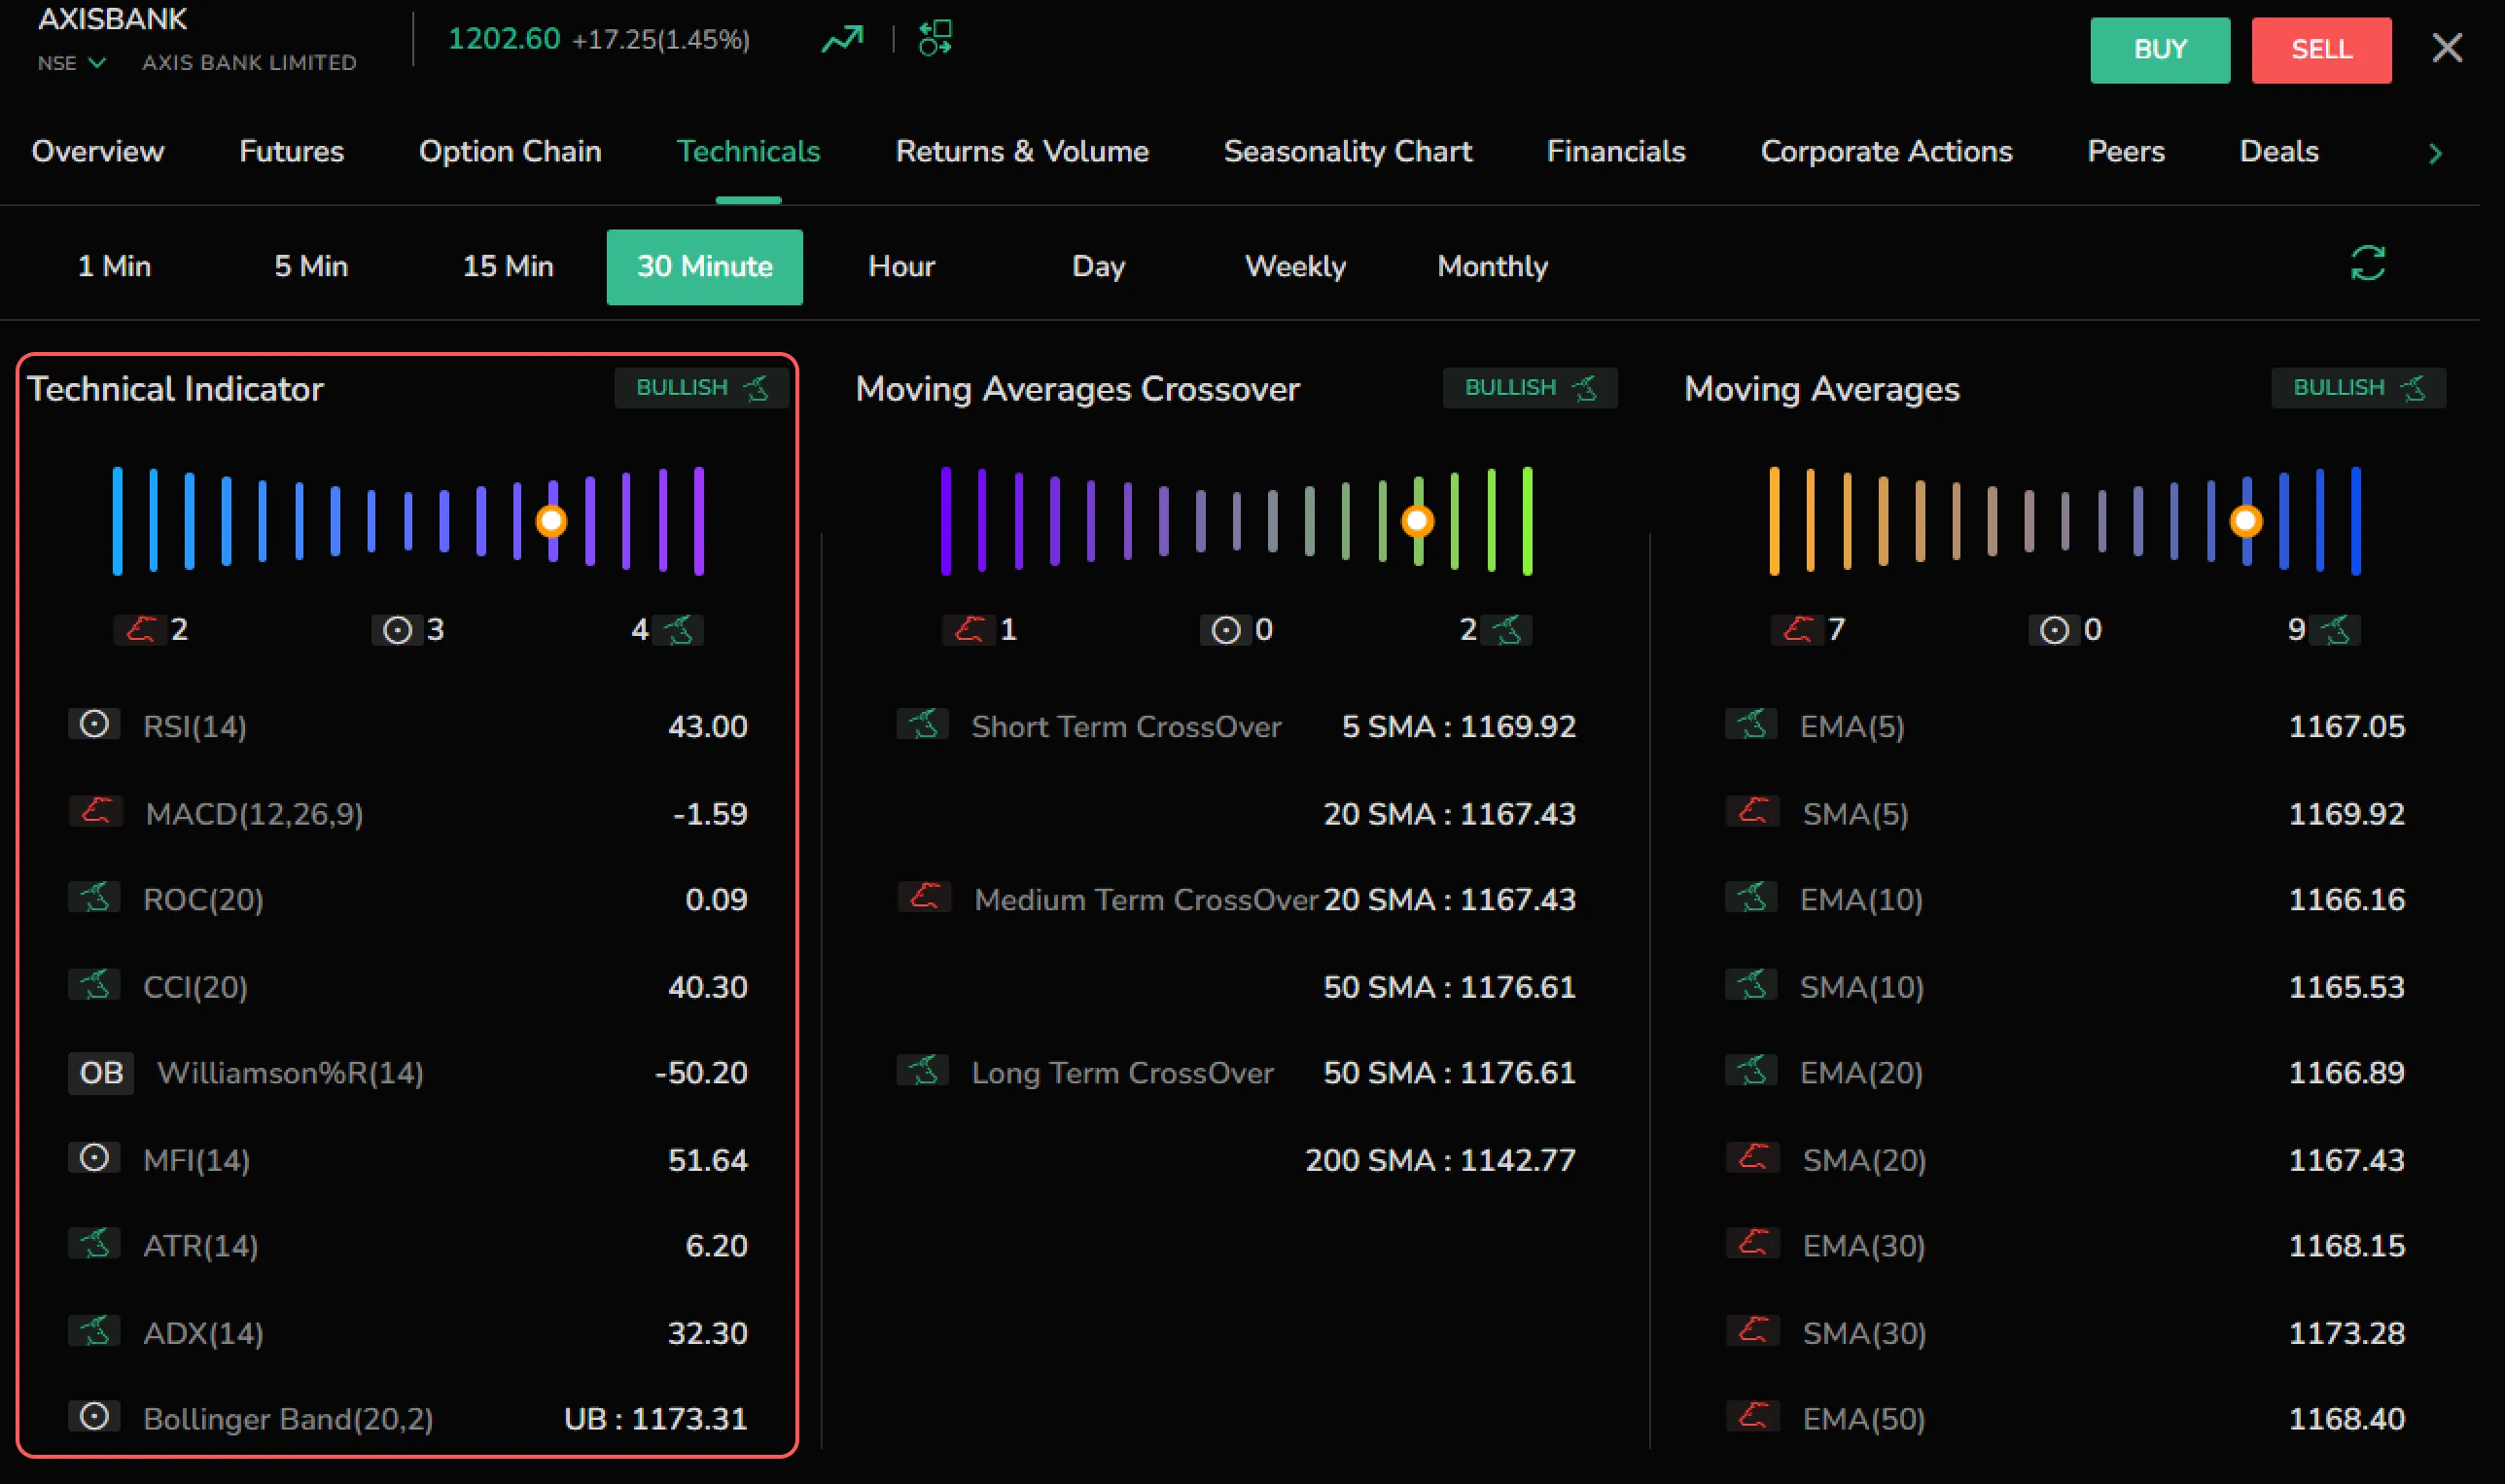
Technical Indicator
This section lists popular indicators, each displaying bullish, bearish, or neutral signs based on their performance. The technical indicator graph provides a summarized view of all indicators.

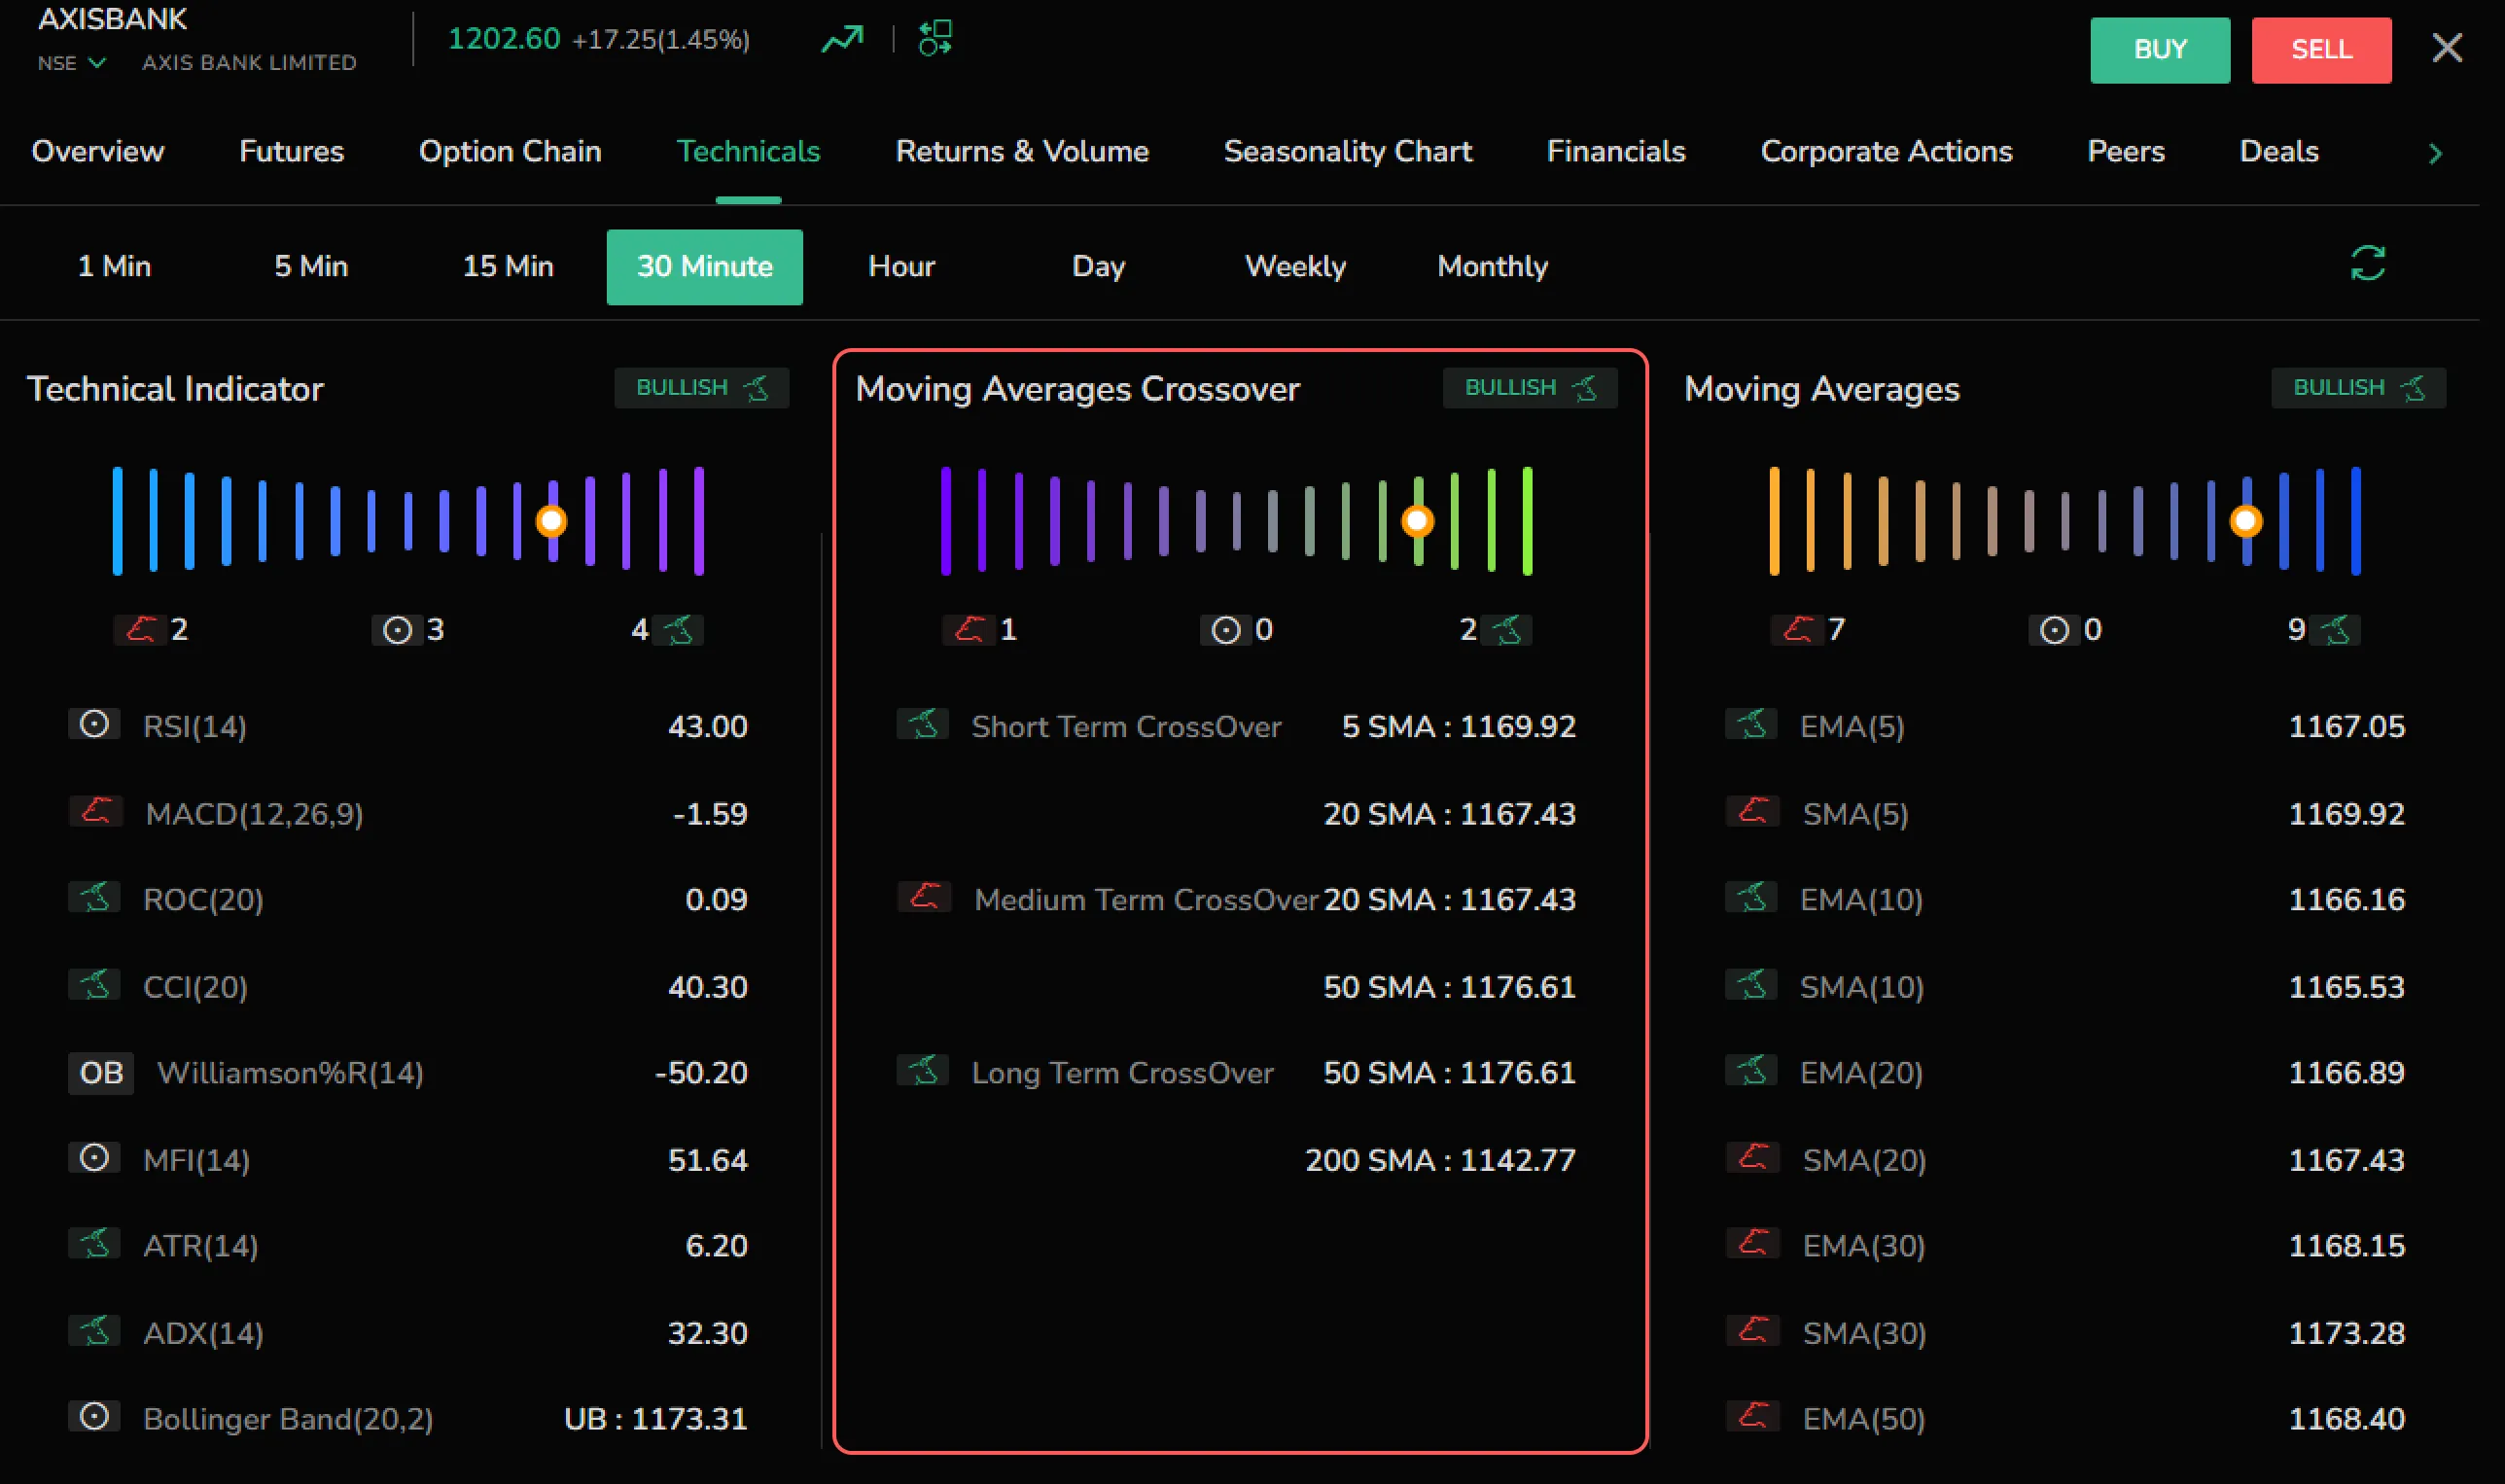
Moving Averages Crossover
Moving averages crossover helps identify potential trend changes in a stock’s price. In CubePlus, the moving average is calculated in three ways.
- Short term crossover
- Medium term crossover
- Long term crossover

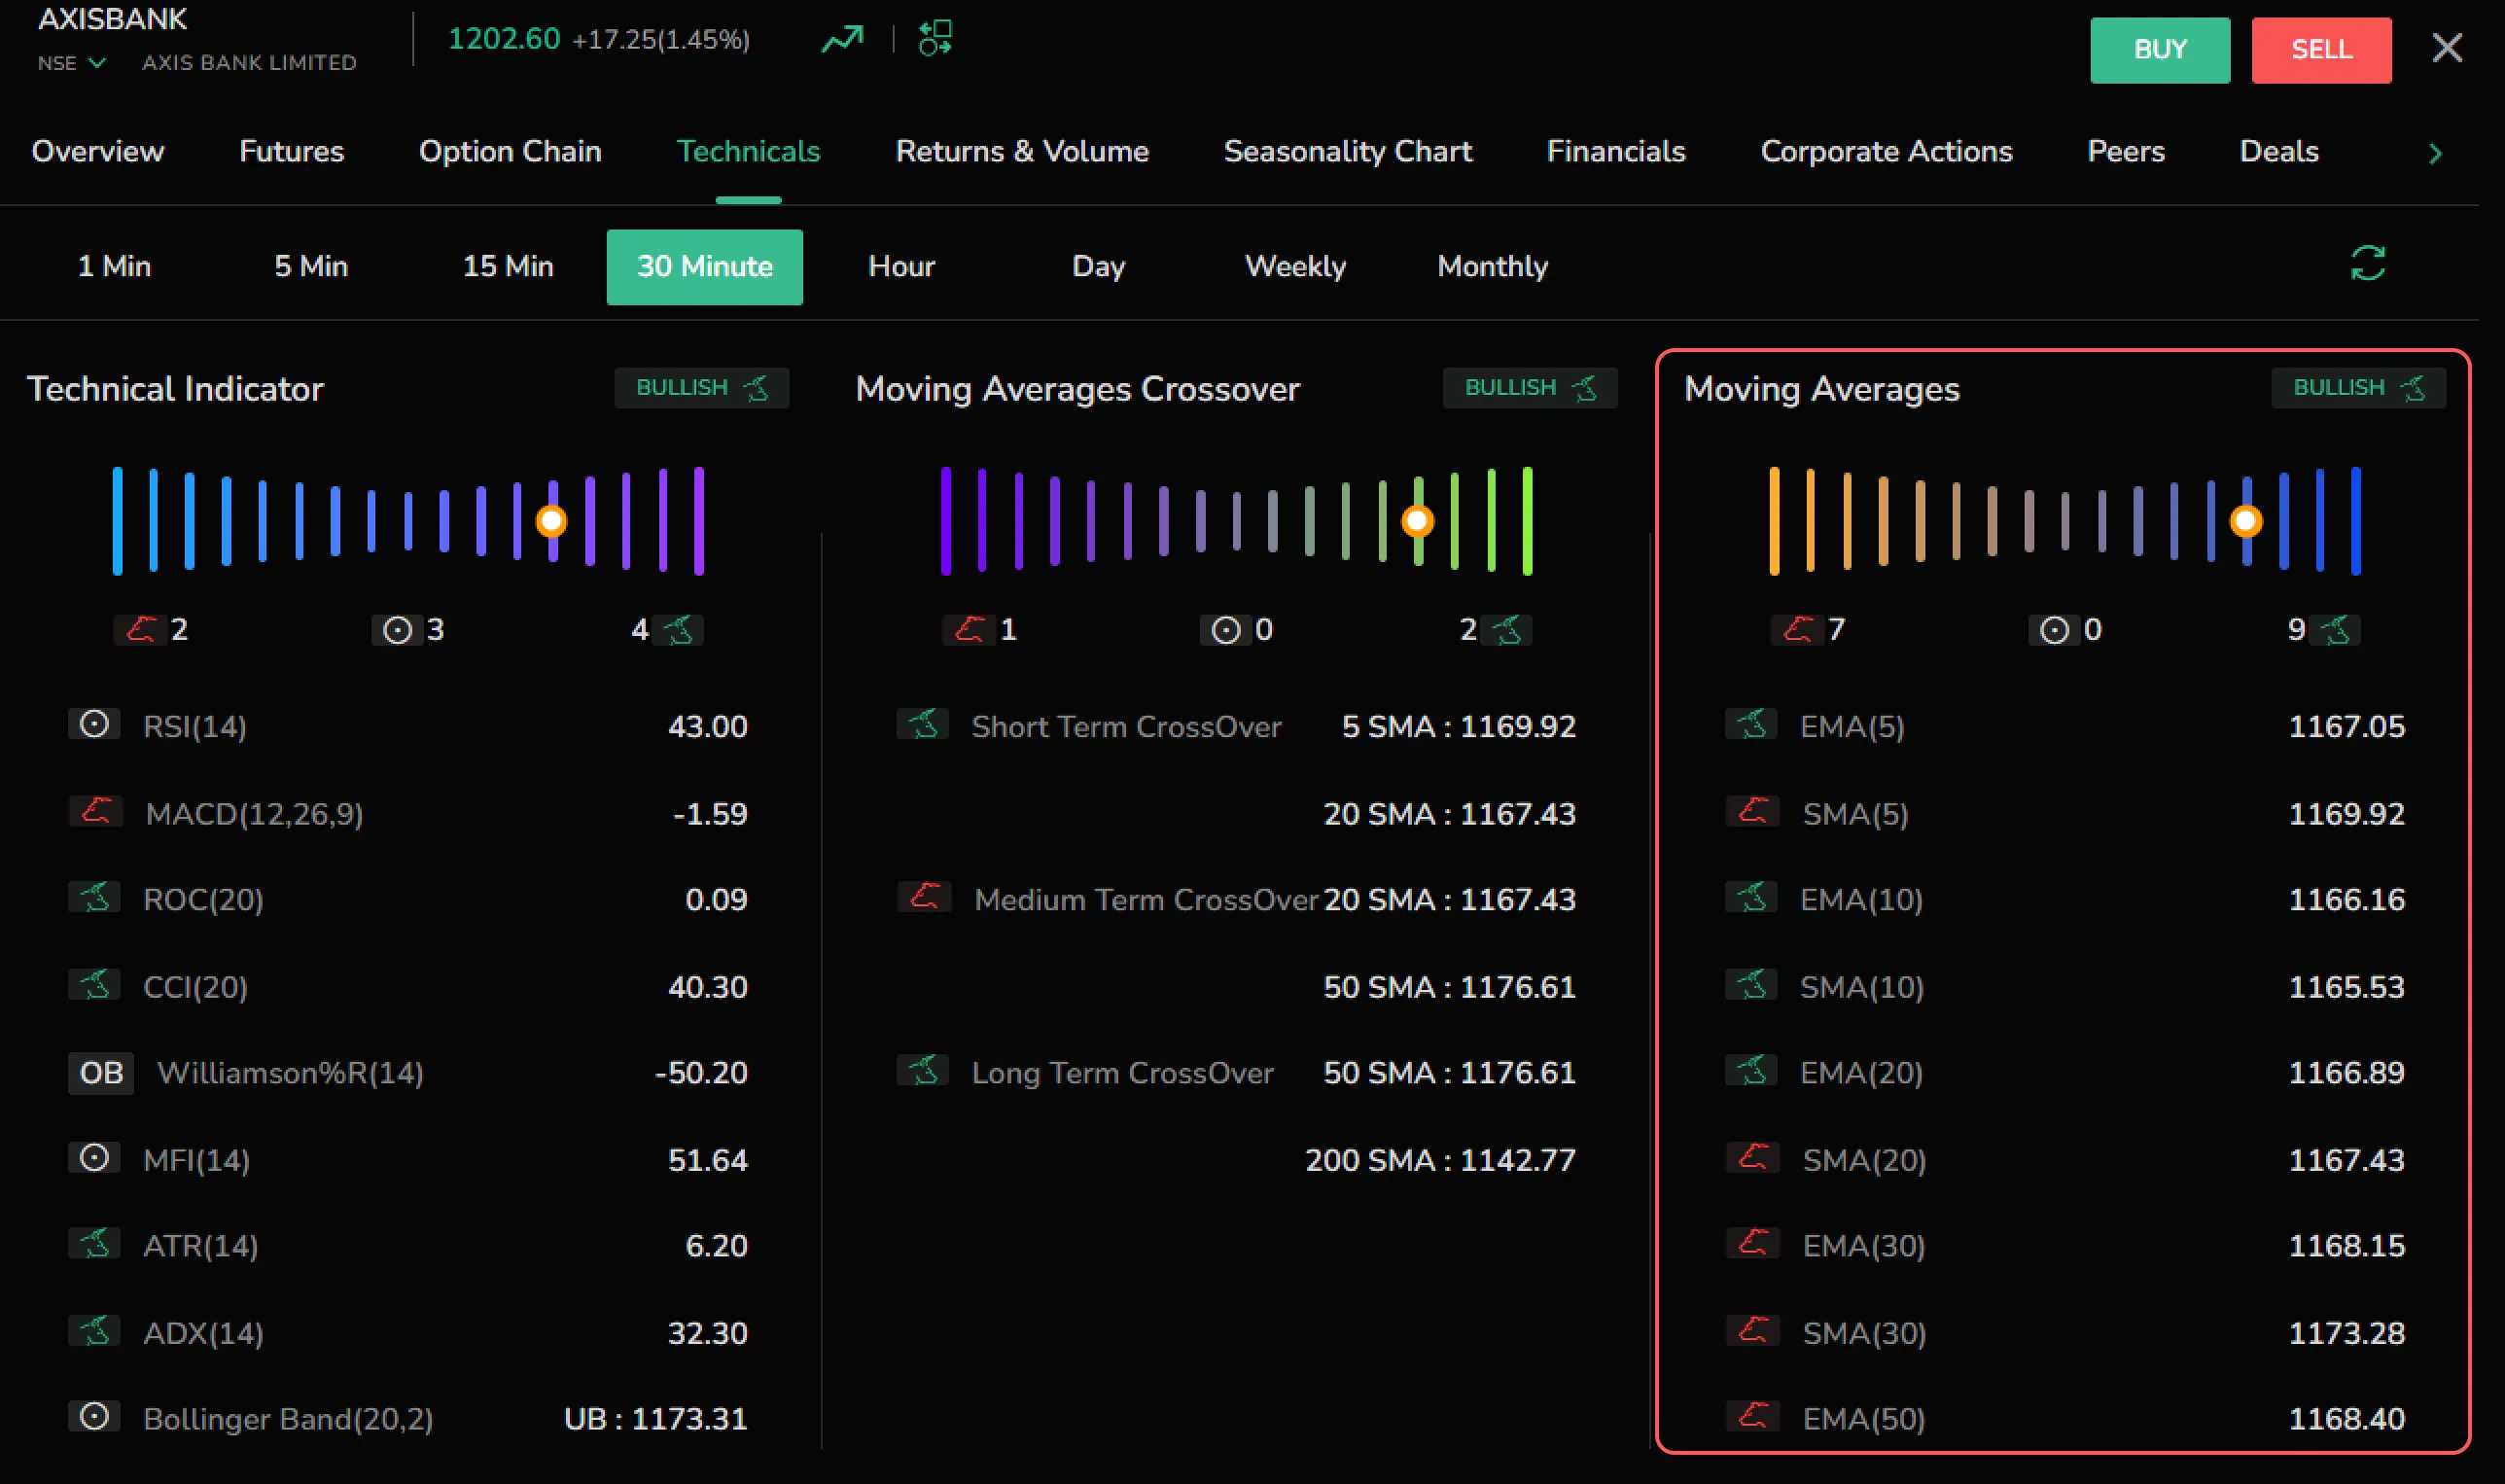
Moving Averages
Moving averages determine a stock’s average price over a set period. CubePlus calculates two types:
- Simple Moving Average (SMA)
- Exponential Moving Average (EMA)

On the Mobile
Access the technical indicator from the Quotes page by clicking on 'Technicals' to view the available indicators.