Quote Overview
On the Web
Click the symbol name in the market watch to get the quote overview of the equity, derivative, commodity, or currency.
Market Depth and performance details are available on the quote overview page. Additionally, the trading day’s and 52 week low and high are represented in bars highlighting the average of the day.
Support and Resistance Details
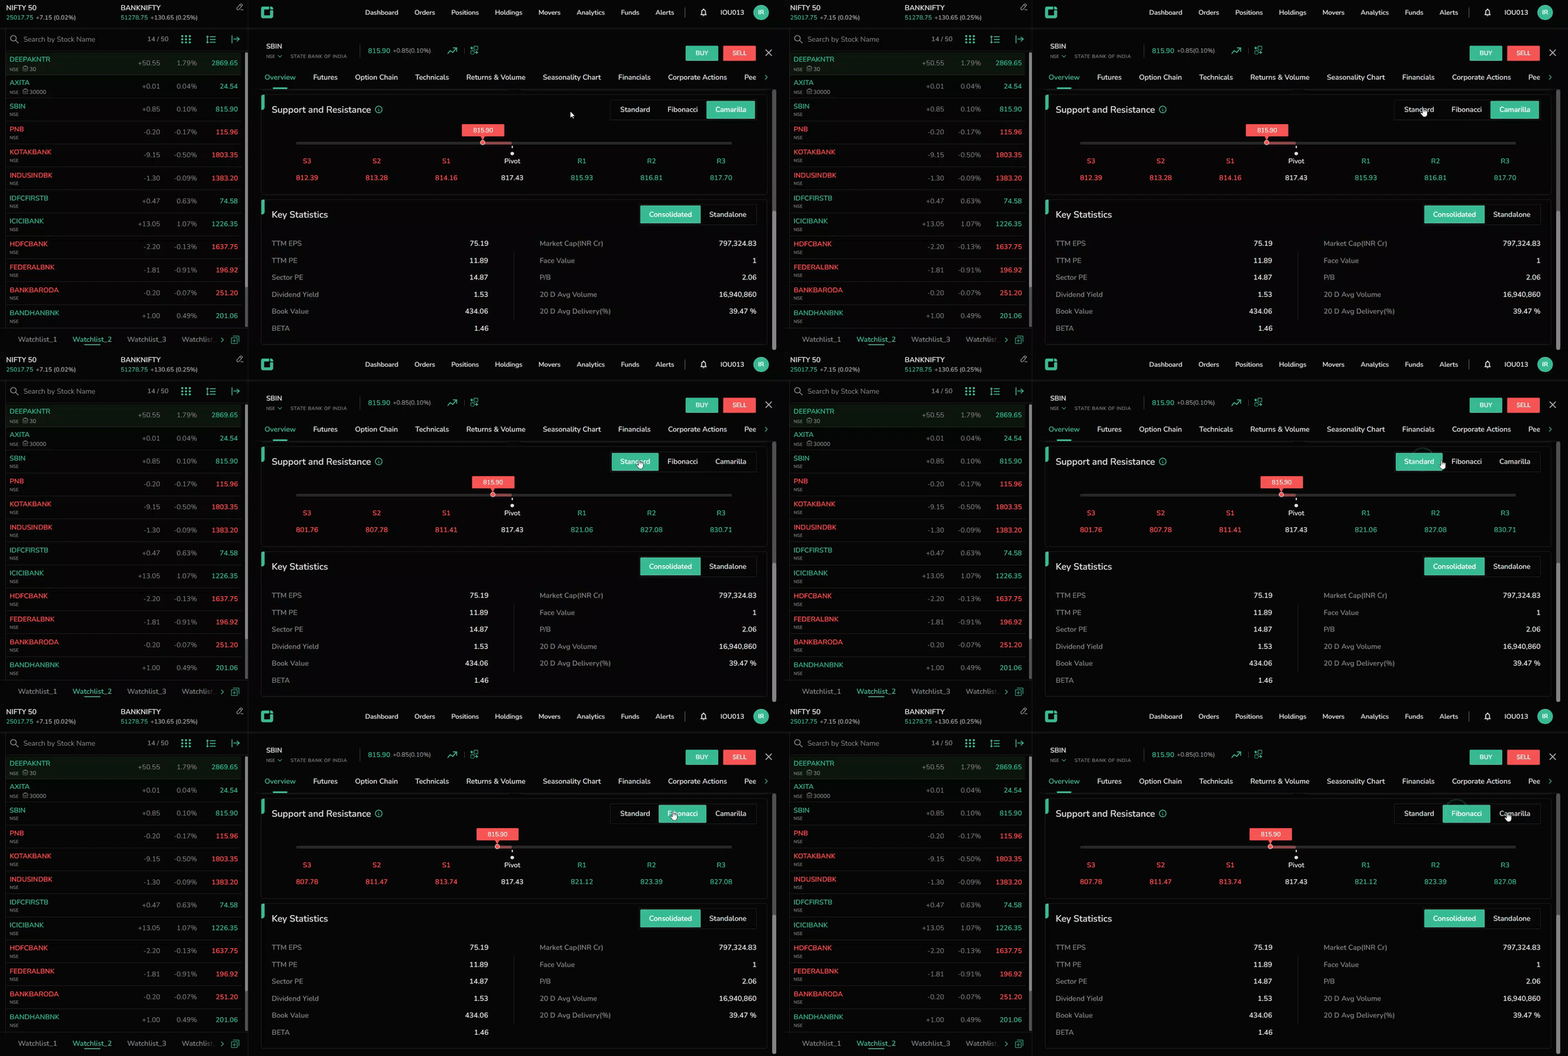
Scroll down to view the Support and Resistance details, highlighting the pivot points plotting. The support and resistance are calculated from the following parameters.
- Standard
- Fibonacci
- Camarilla

Key Statistics
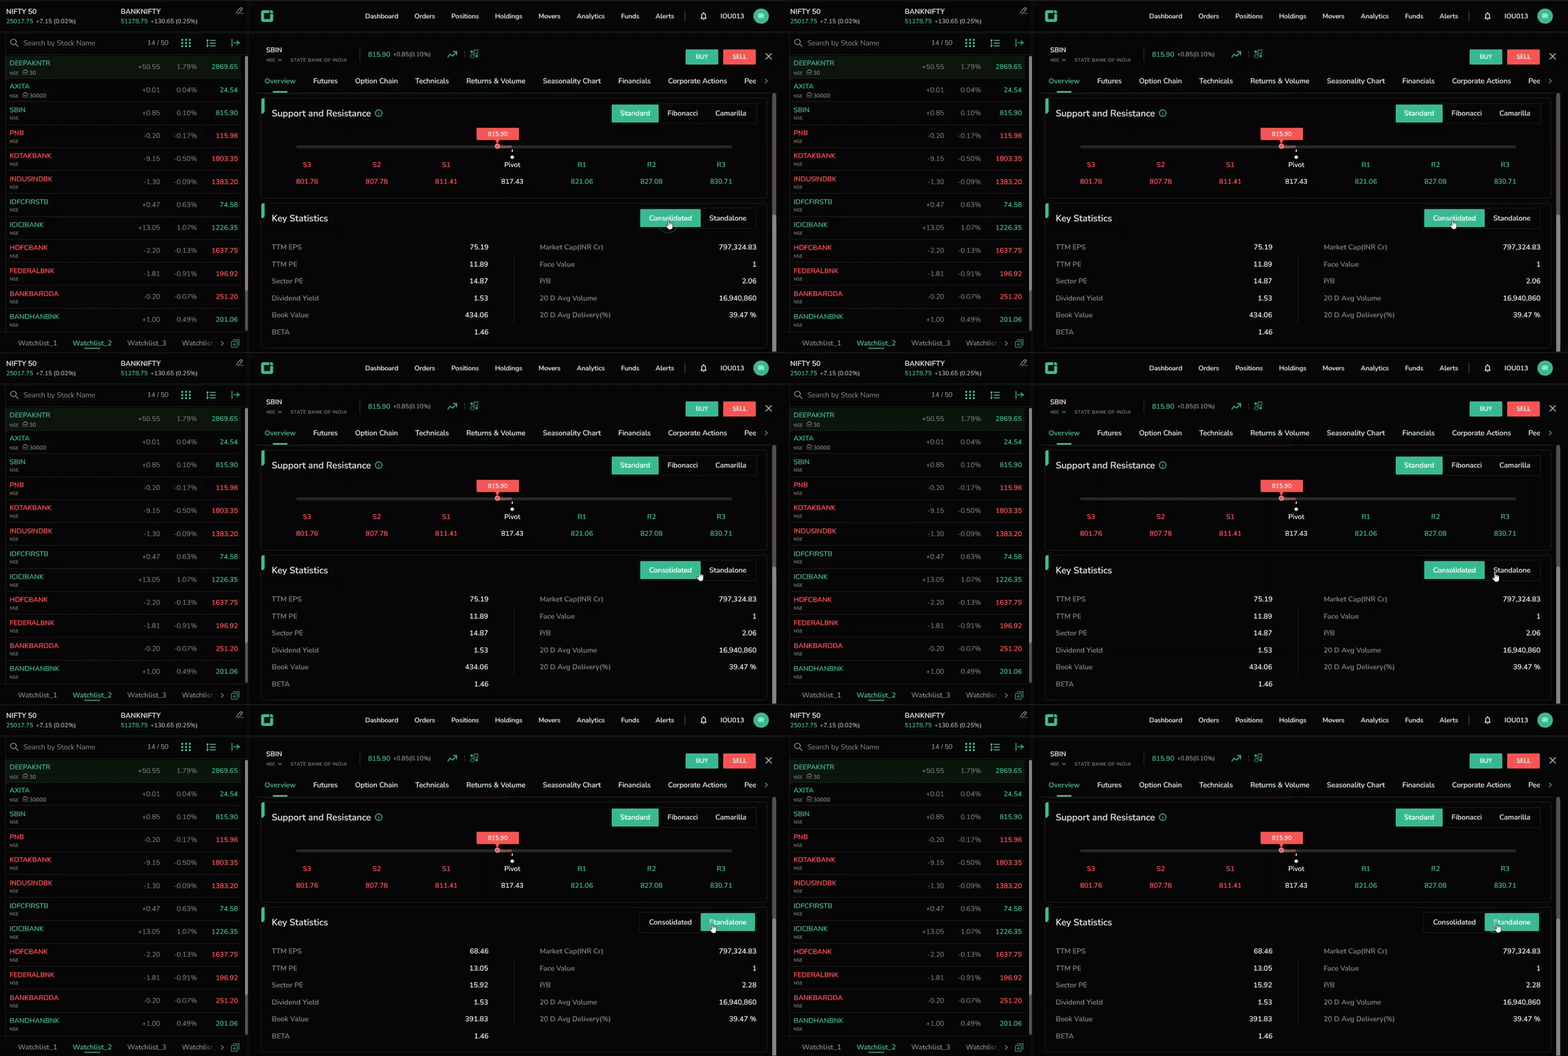
Quote Overview for Equity comes with additional details on key statistics. Key statistics are available in two categories:
- Consolidated
- Standalone

Here are the particulars available under key statistics:
- TTM EPS (Trailing Twelve-Month Earnings Per Share)
- TTM PE (Trailing Twelve-Month Price/Earning Ratio)
- Sector PE
- Dividend Yield
- Book Value
- BETA
- Market Cap (INR Cr)
- Face Value
- P/B
- 20 D Avg Volume
- 20 D Avg Delivery (%)
On the Mobile
Swipe up on the Market Depth to access the Quotes page on mobile. Below the Market Depth, users can find quick links to other features such as:
- GTT
- Fundamentals
- Technicals
- Watchlist
- Alerts
- SIP
- Basket
The Quotes page also includes a chart preview with intervals ranging from one day to one year. Users can tap the candlestick icon to view detailed charts.

Additional information includes:
- Upper circuit
- Lower circuit
- Last traded quantity
- Last traded time
