Charts
On the Web
CubePlus charts offer a comprehensive suite of tools, featuring over 100 indicators, 15+ chart styles, and 30 drawing tools. Chart's timeframes range from one day to five years with bars/candles ranging from 1 minute to 1 month.
Chart Features
Accessing Charts
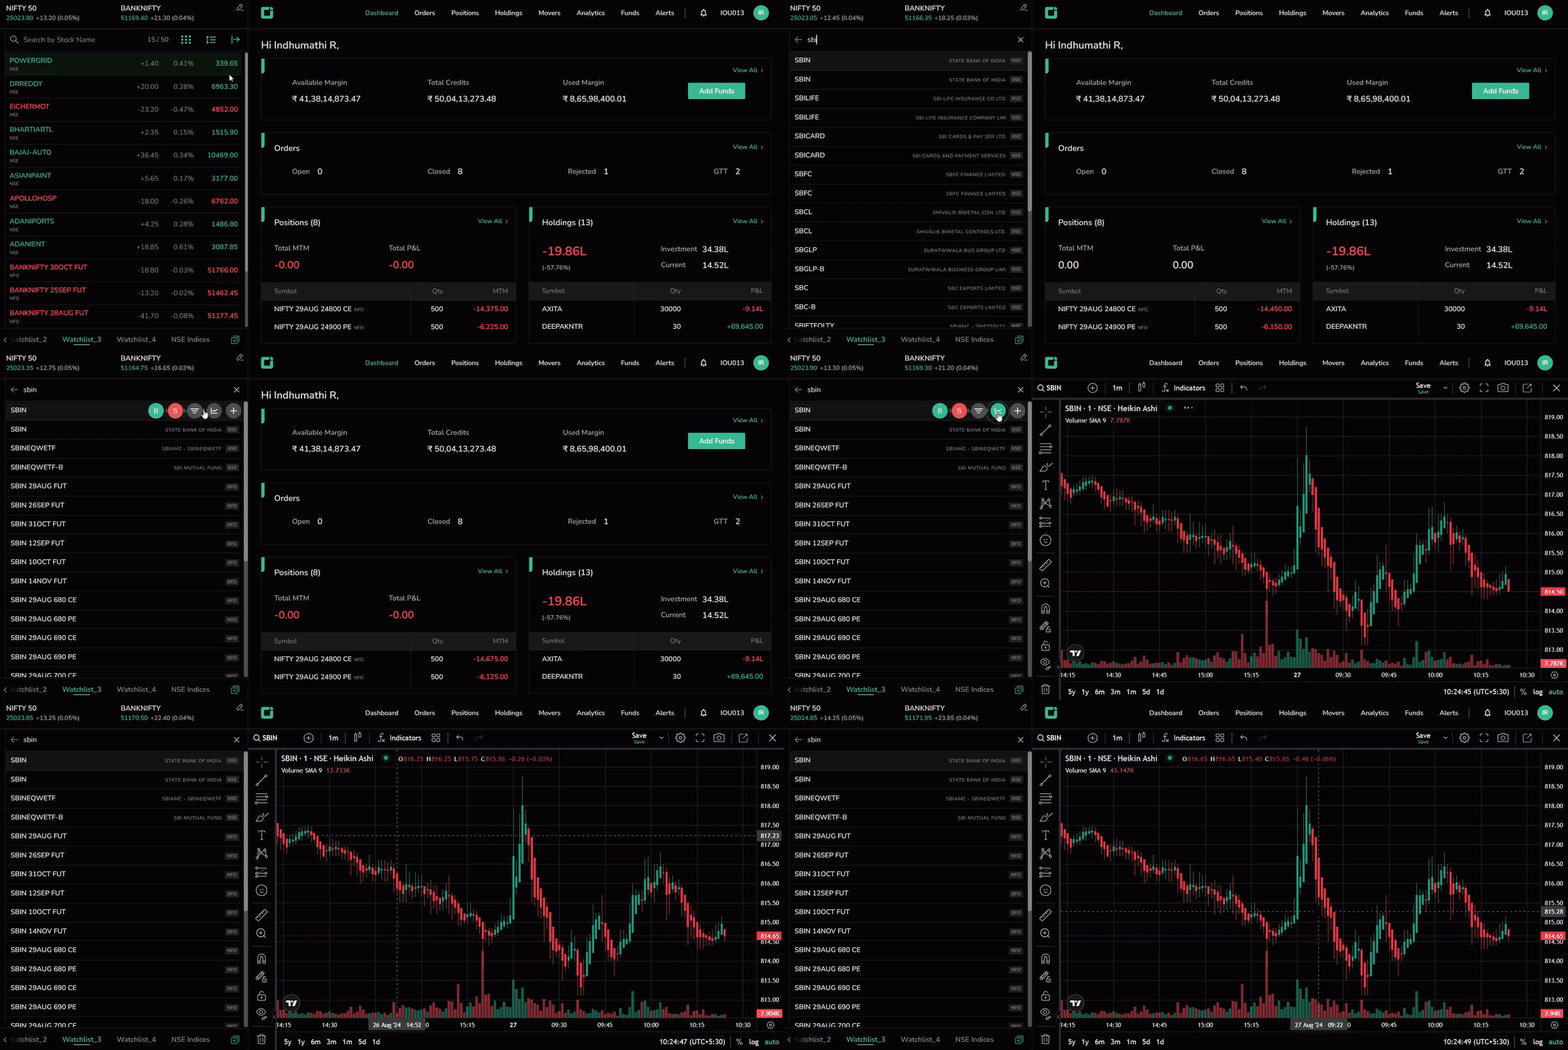
Tap the instrument in mobile app or hover over instrument in web app and select the chart icon to view charts.
Searching Instruments
Type the instrument name in the search bar to access its chart.
Changing Timeframes
Daily data is displayed by default, but you can switch to any preferred timeframe. Intraday charts range from 1 minute to 4 hours, while history charts span days, weeks, and months.
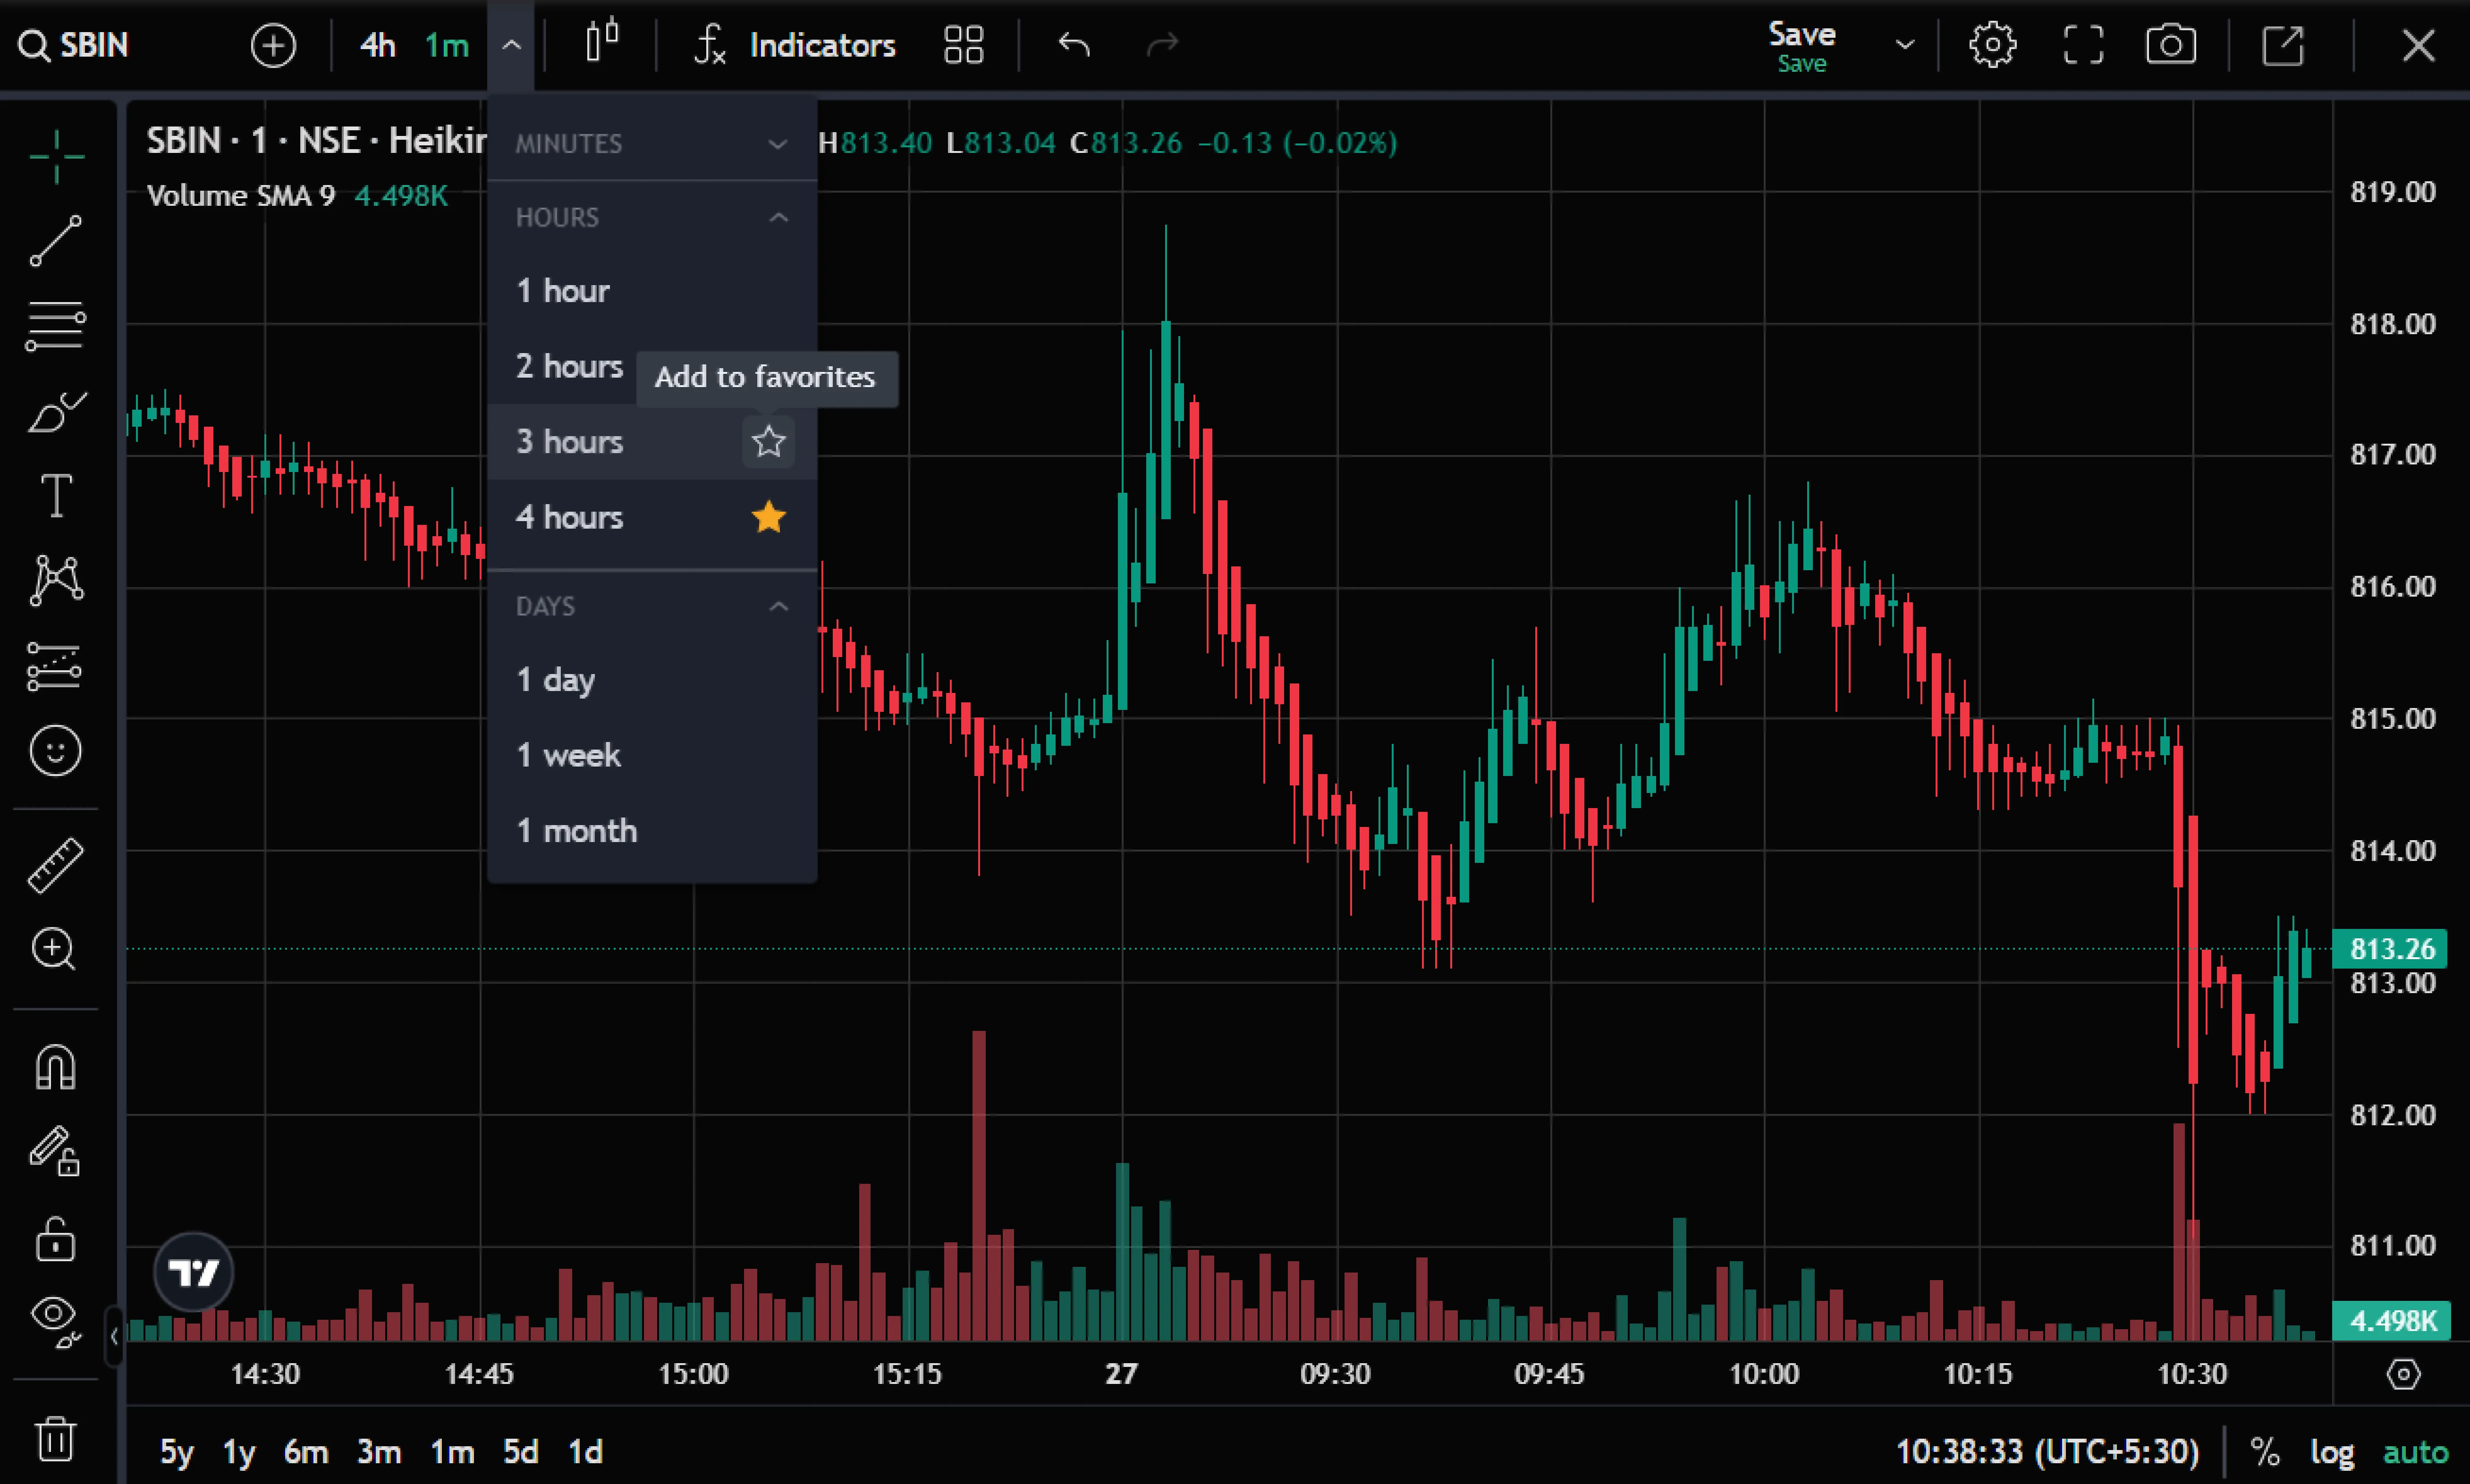
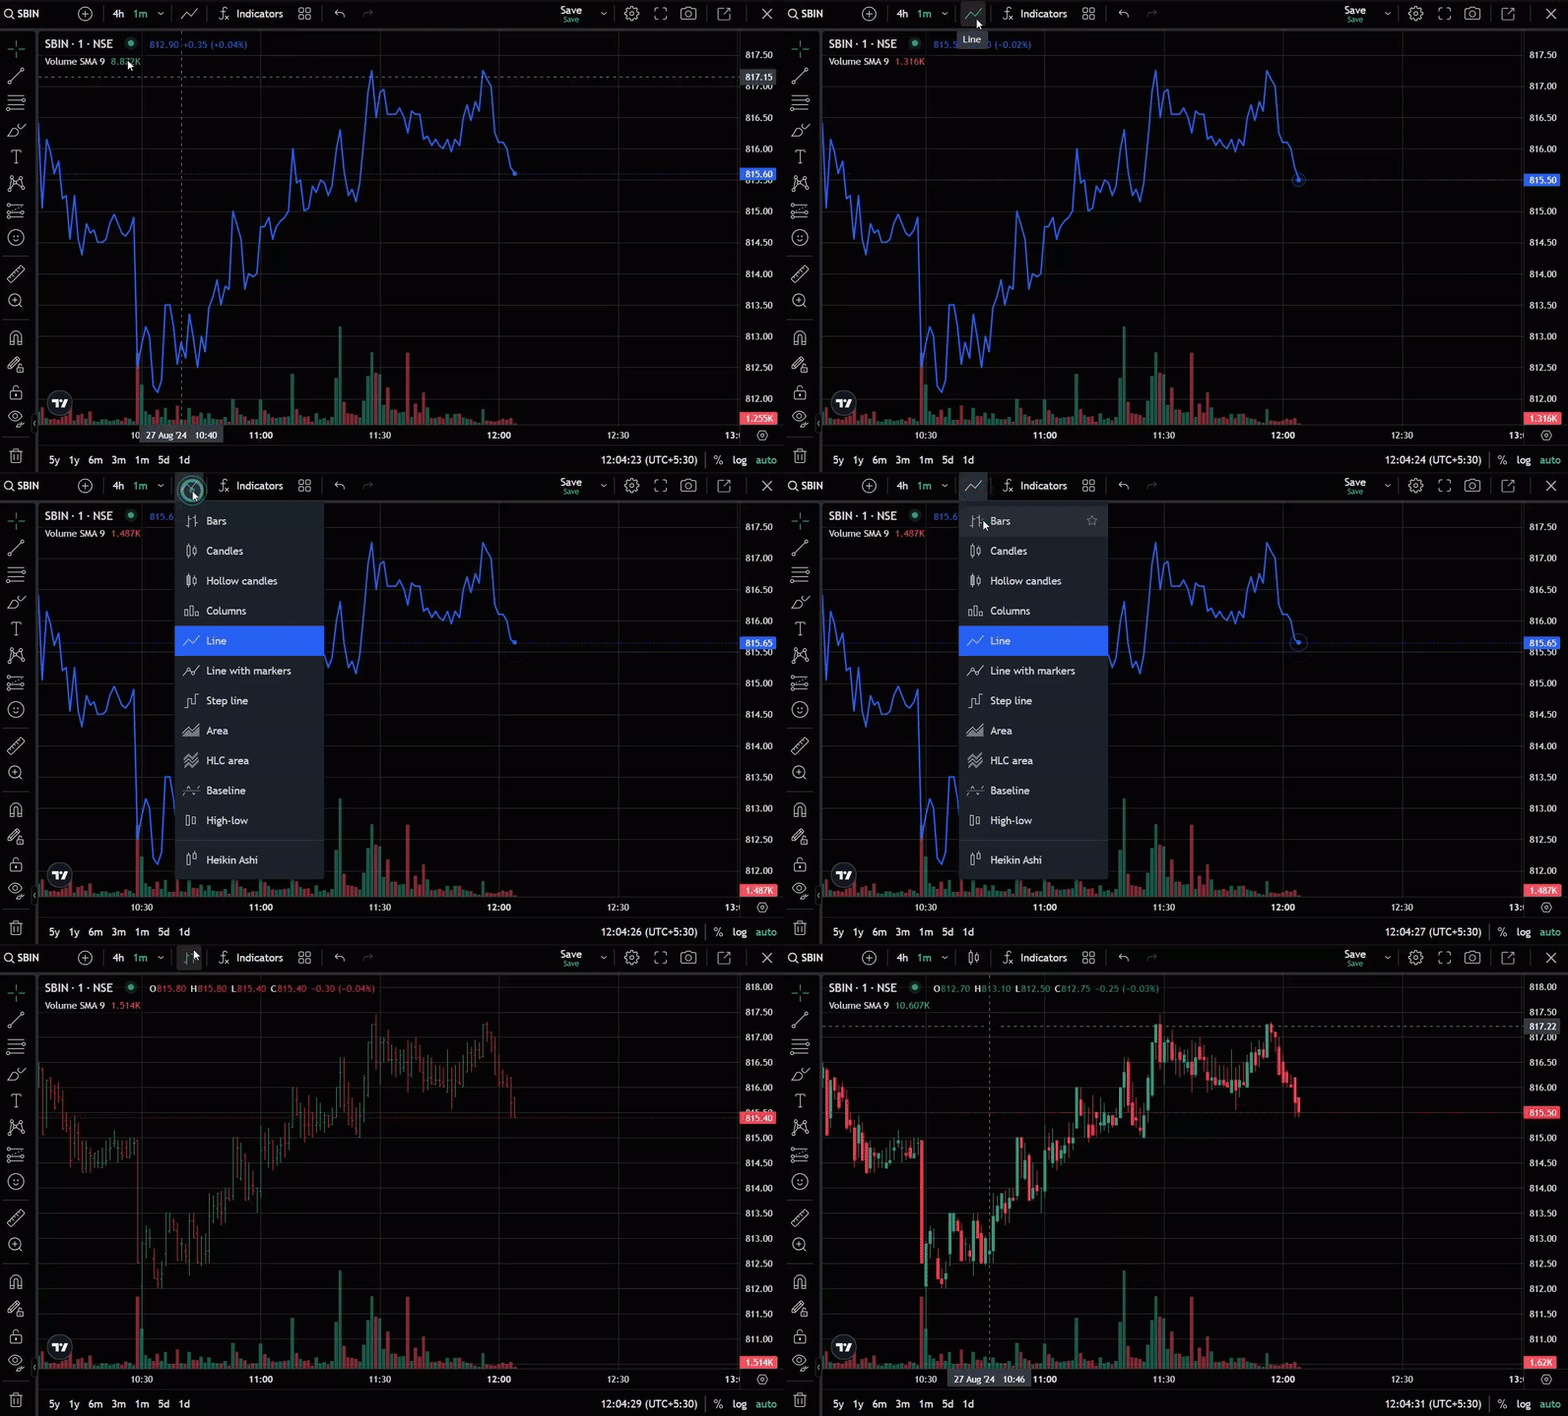
Chart Style
Select the icon at the top to customize the chart style, with over twelve options available.
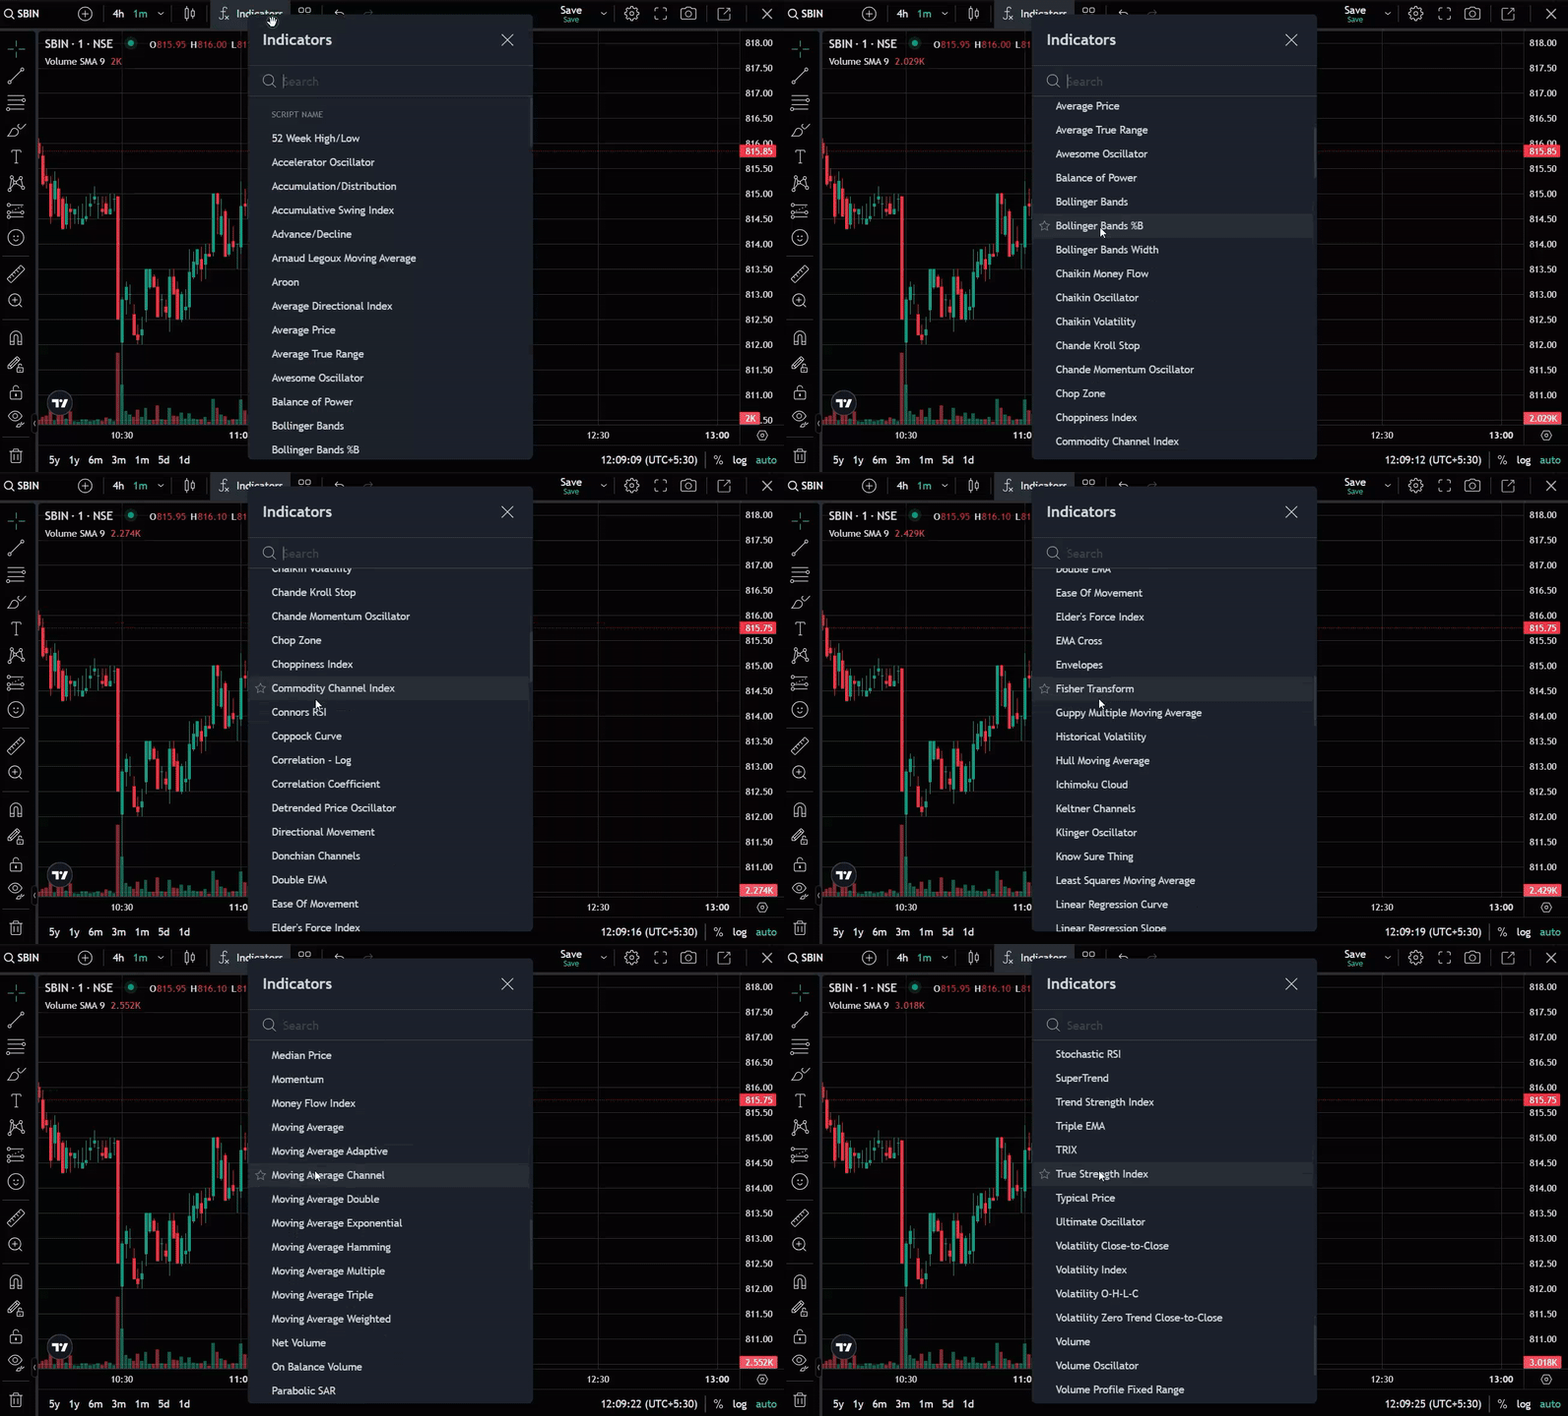
Indicators and Strategies
Click on the indicator icon to add indicators to your chart. Use the search bar to find specific indicators.
Saving Indicator Templates
Save indicator templates by clicking the save icon. Name your template and choose to remember the symbol and interval.
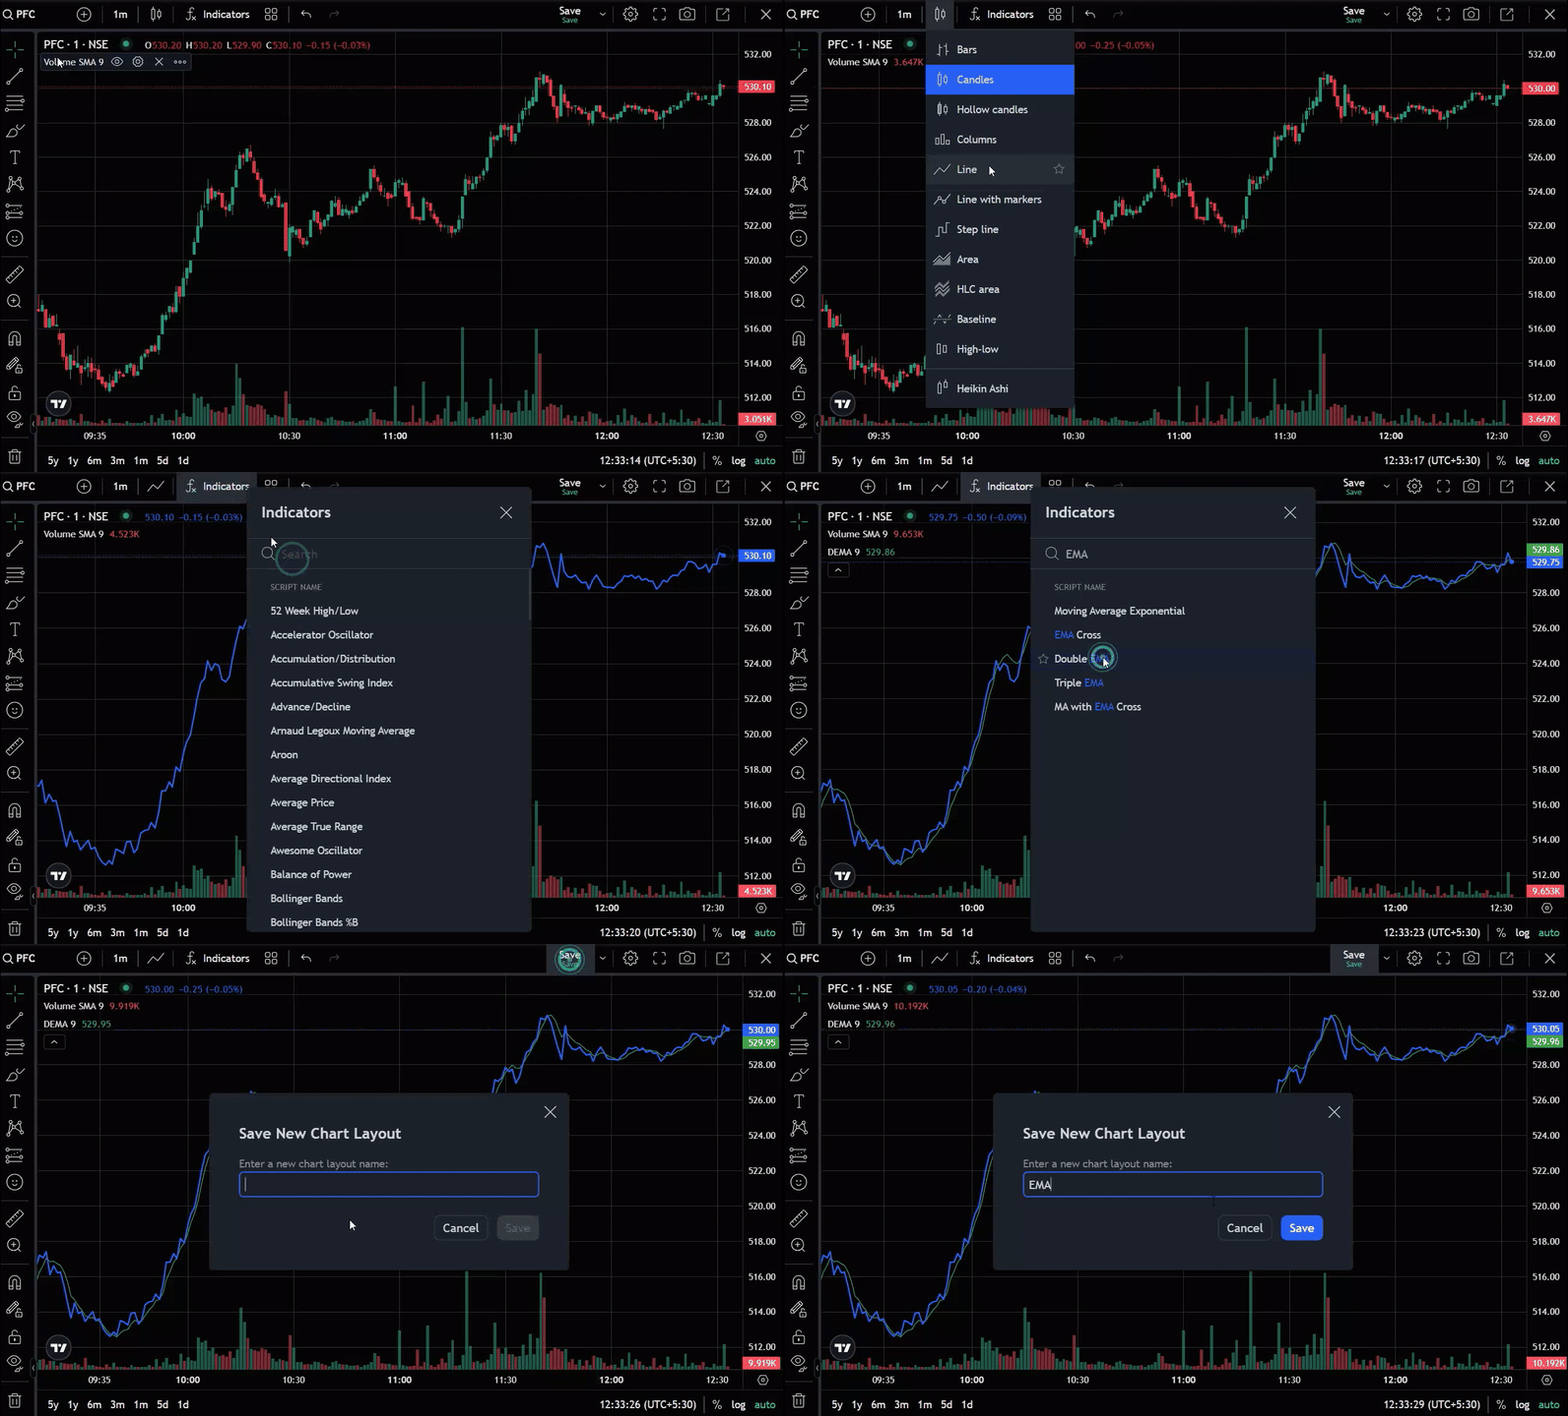
Saving Default Layout
Save your layout as the default so it appears automatically every time you access charts.
Deleting Default Layout
Deleting your default layout preferences will clear the saved indicators and templates.
Chart Settings
- Symbol: Customize price source, line color, precision, and timezone.
- Status Line: Select checkboxes to display specific details on the chart.
- Scales: Adjust labels on the price scale by clicking the relevant checkboxes.
- Canvas: Modify basic chart styles by navigating the canvas settings.
Other Features
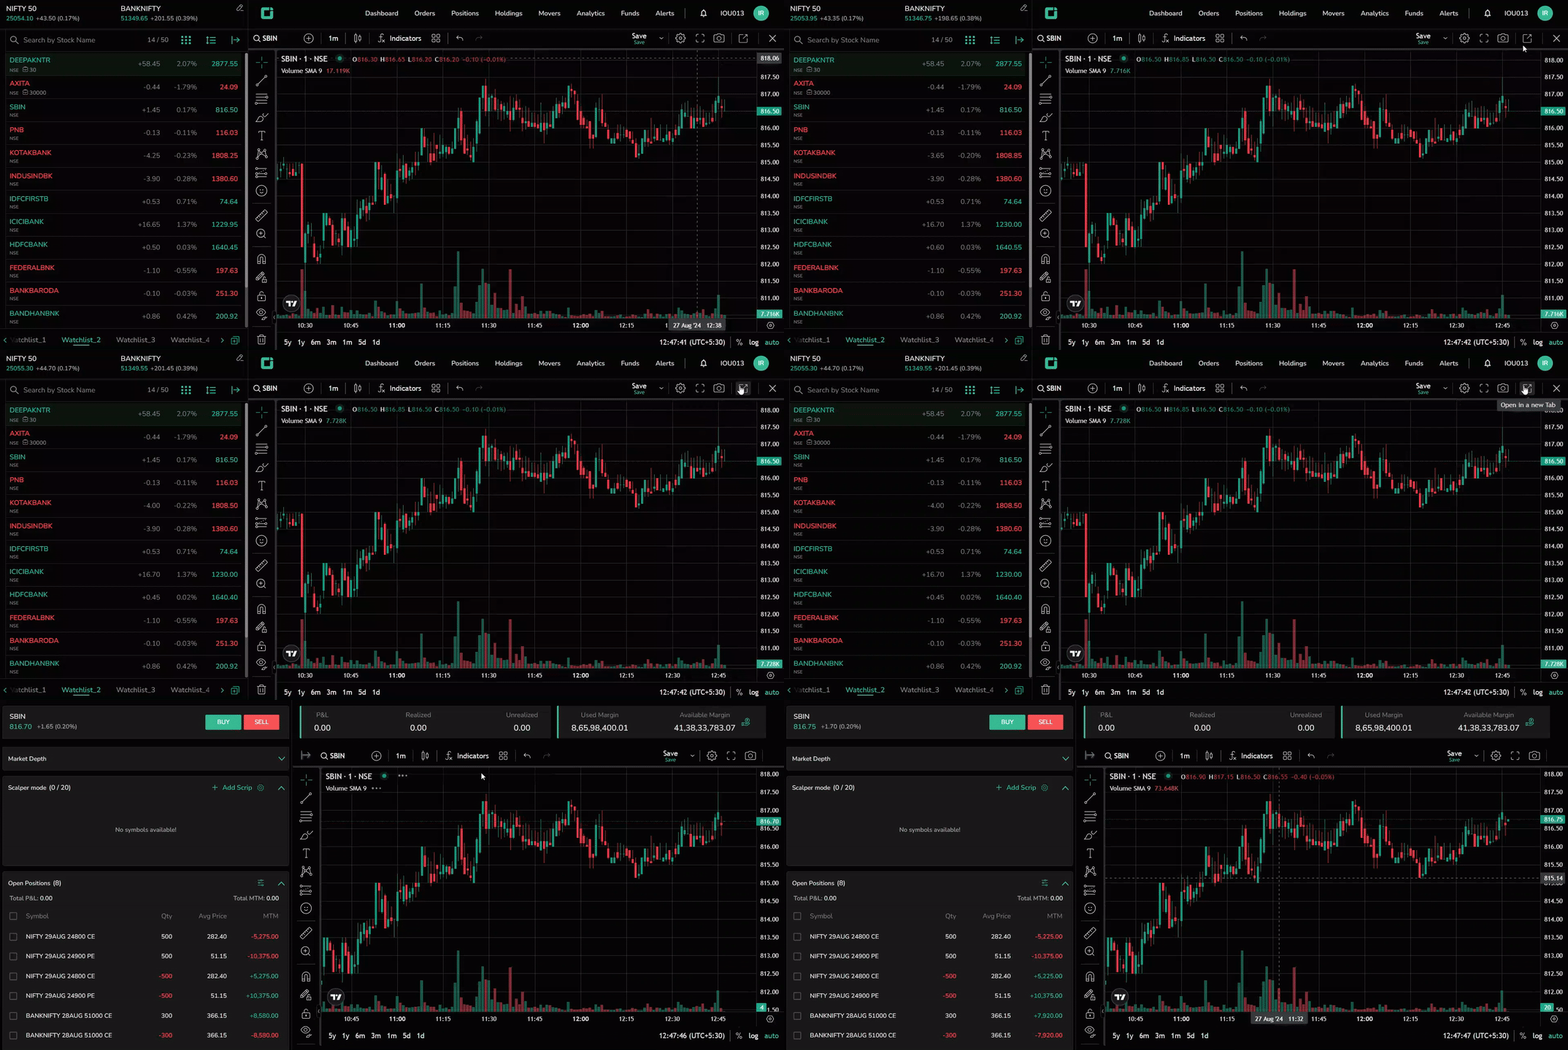
- Expand the chart to full screen by clicking the icon or pressing ‘Shift+F.’
- Capture a screenshot by clicking the camera icon.
- Redirect the chart to a new tab by clicking "open in a new tab," where users can directly buy and sell.
Drawing Tools
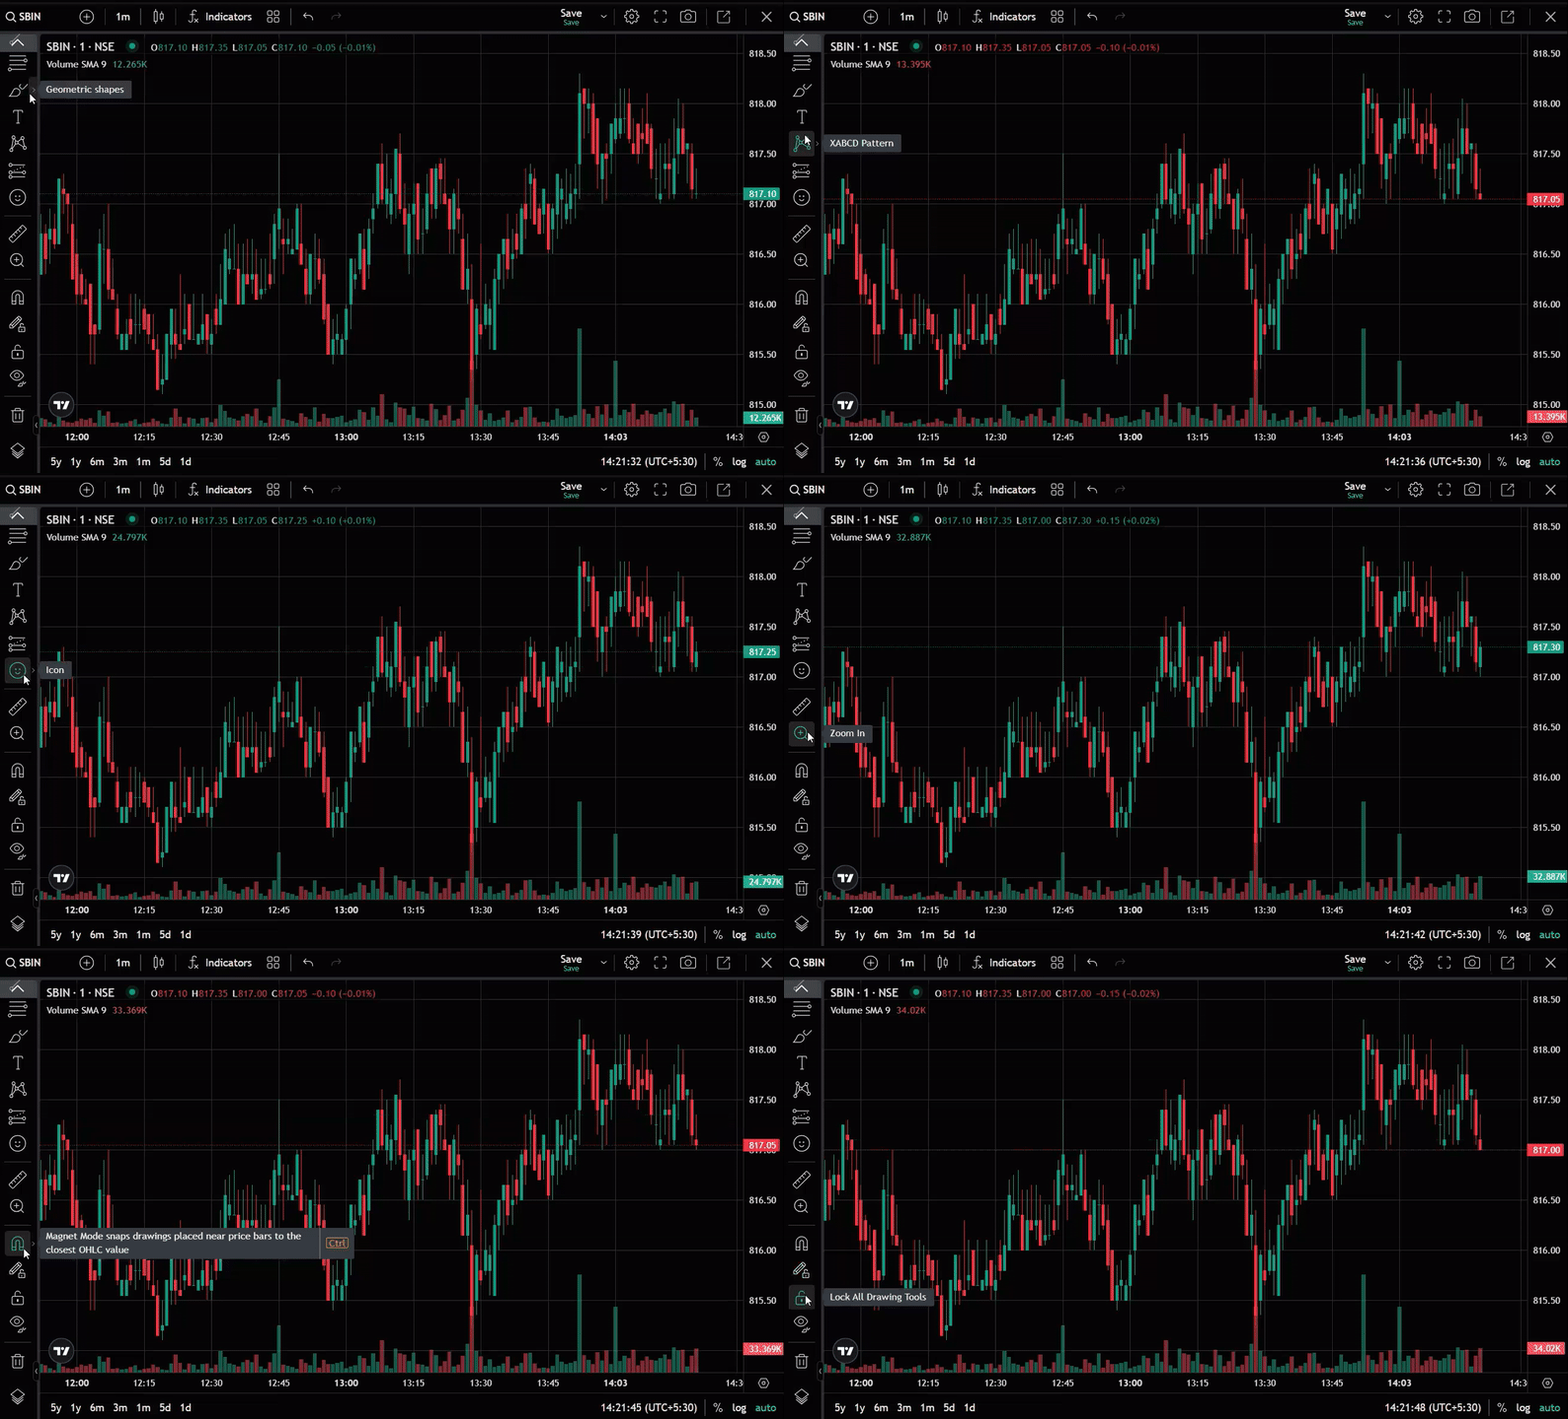
Available drawing tools include:
- Cross
- Trend line
- Fib retracement
- Pattern
- Long Position
- Icon
- Measure
- Zoom in
- Magnet mode
Additional Drawing Features:
- Stay in drawing mode
- Lock all drawing tools
- Hide all drawings
On the Mobile
A chart preview is available on the quote overview screen in the mobile app. Tap the chart icon to access the full version.
The buy and sell options are accessible directly from the charts screen.
To switch to landscape view, tap the mobile icon to expand the chart.
