Returns & Volume
Returns and volume are essential metrics for evaluating a stock's or market's performance.
- Return refers to the profit or loss an investor realizes from holding or selling a stock over a set period.
- Volume measures the total number of shares traded (both bought and sold) during a specific time frame.
Access Returns & Volume
Navigate to Returns & Volume from the Quotes page.
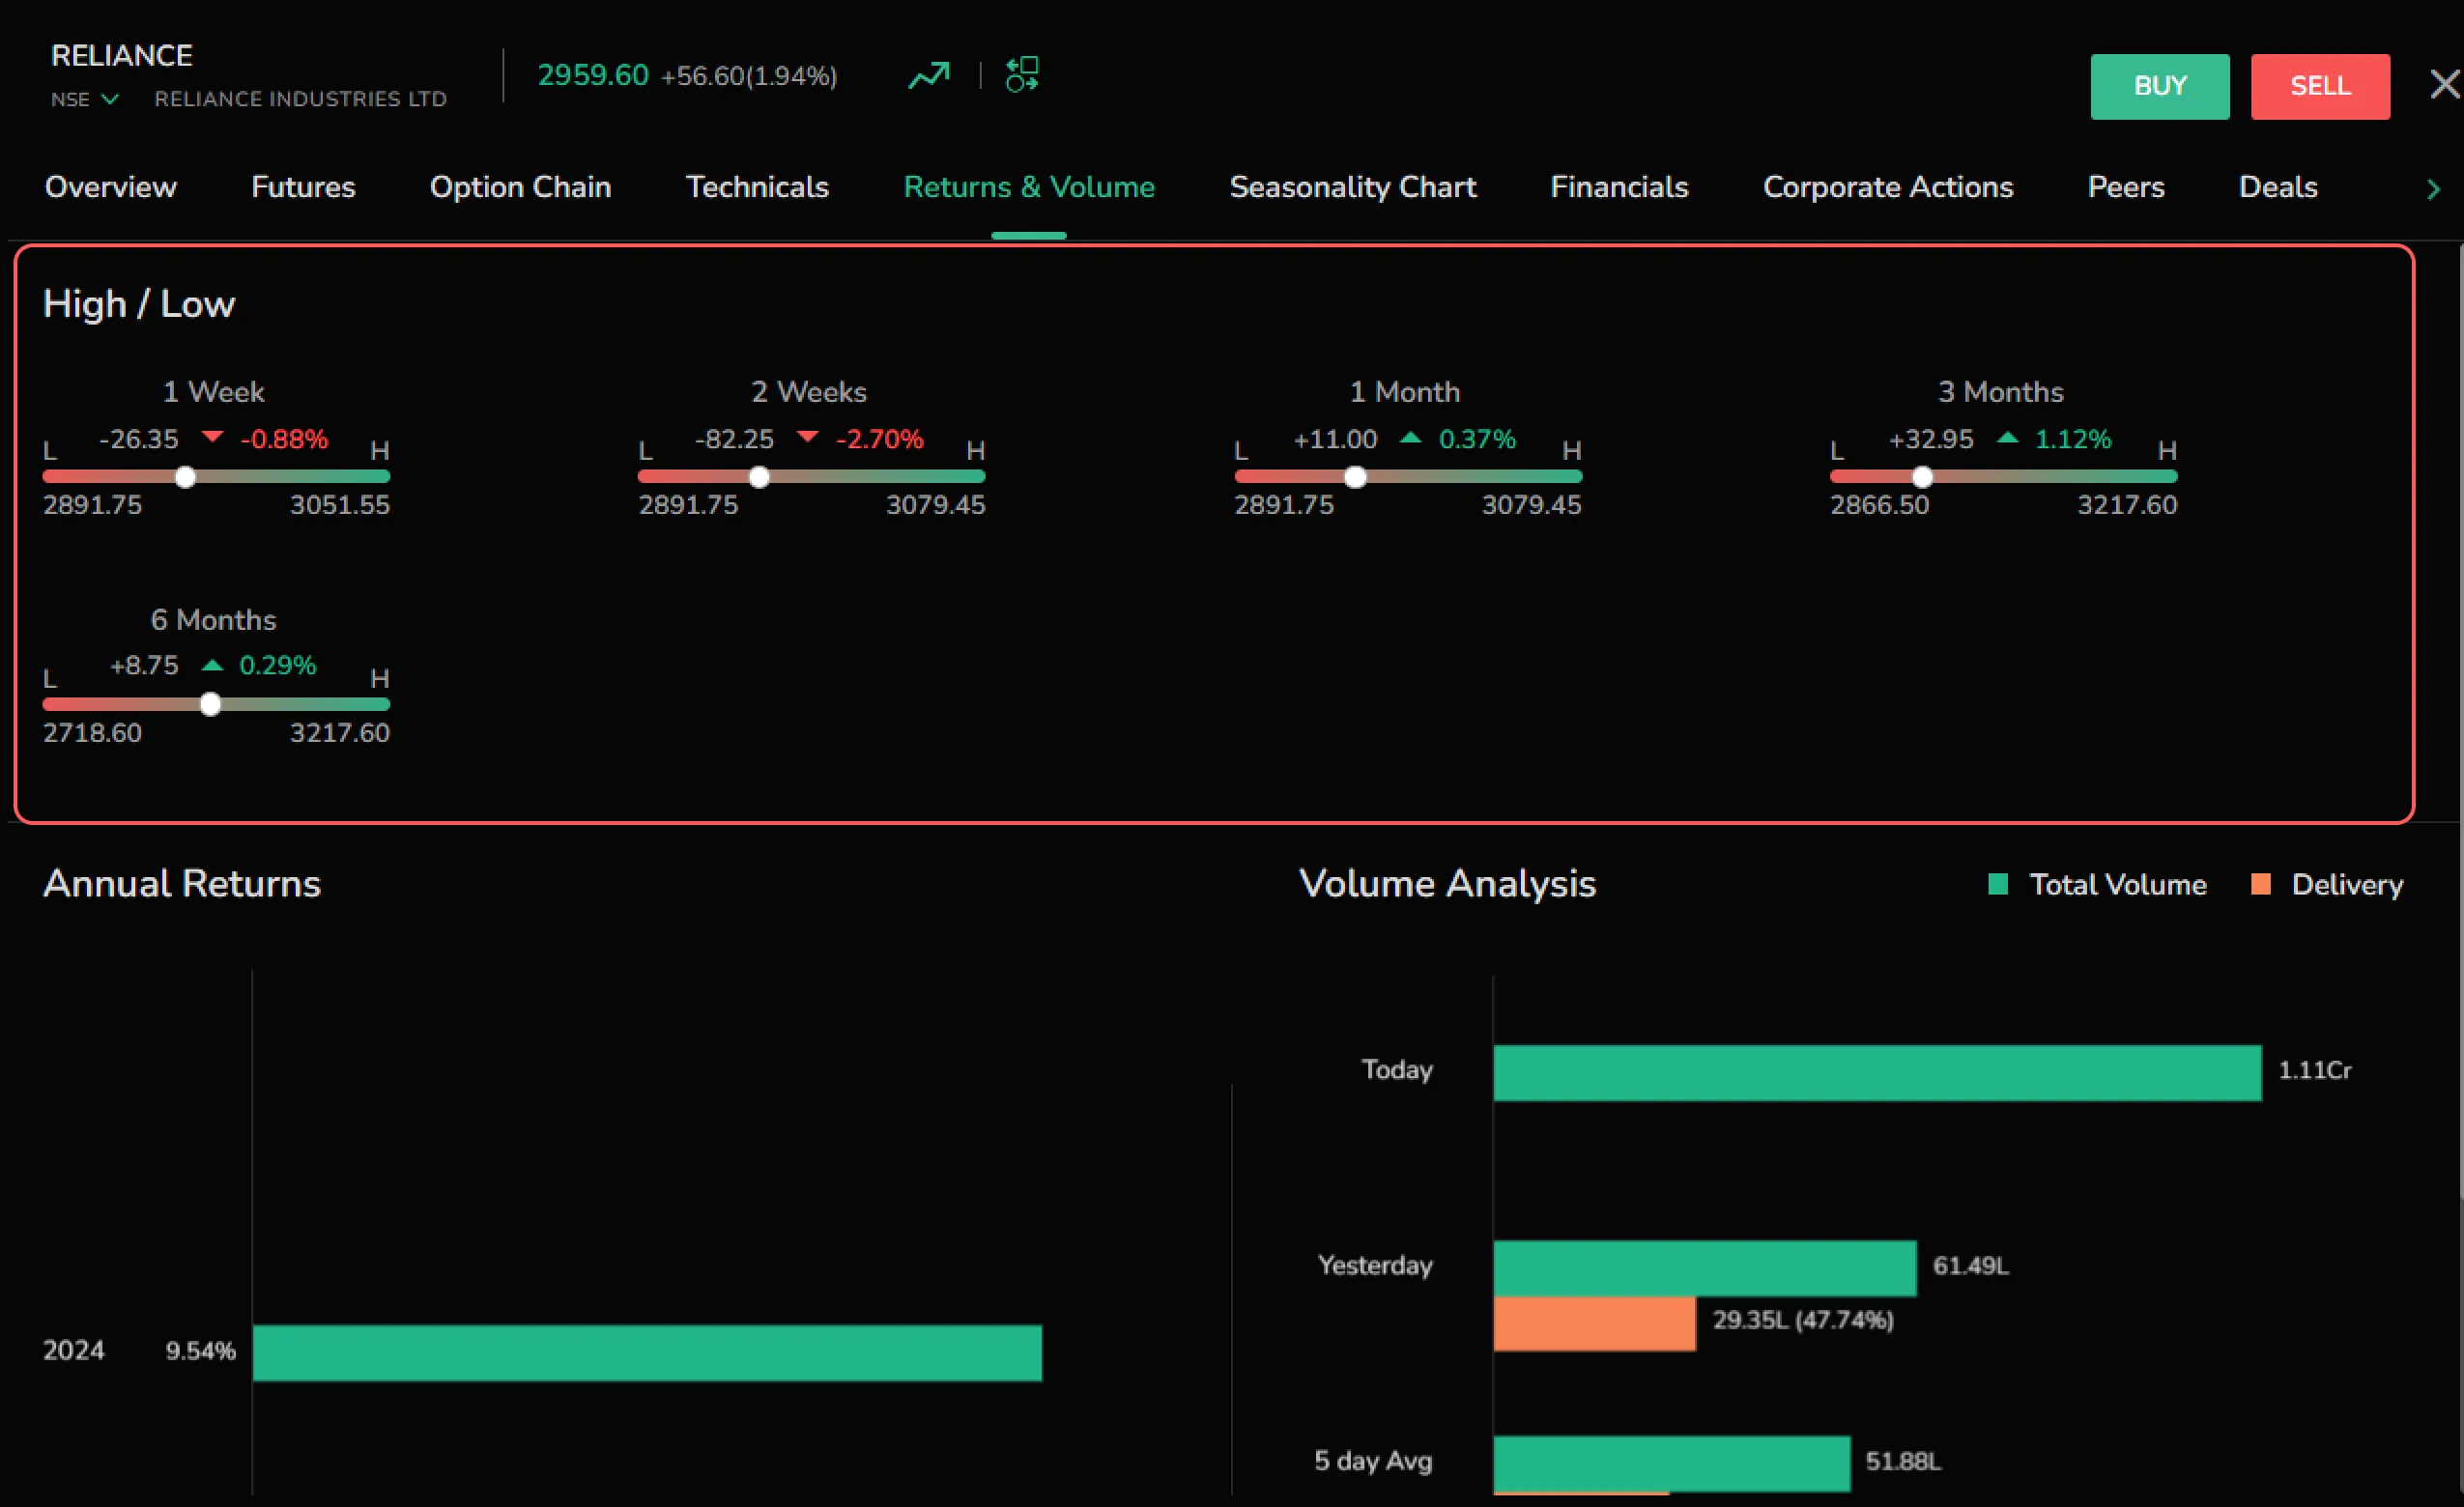
High/Low
Access Returns data for,
- 1 week
- 2 weeks
- 1 month
- 3 months
- 6 months
- 1 year
- 3 years
- 5 years
The data is displayed graphically, showing low and high prices with LTP plotted. The change and percentage change are indicated above the horizontal bar graph.

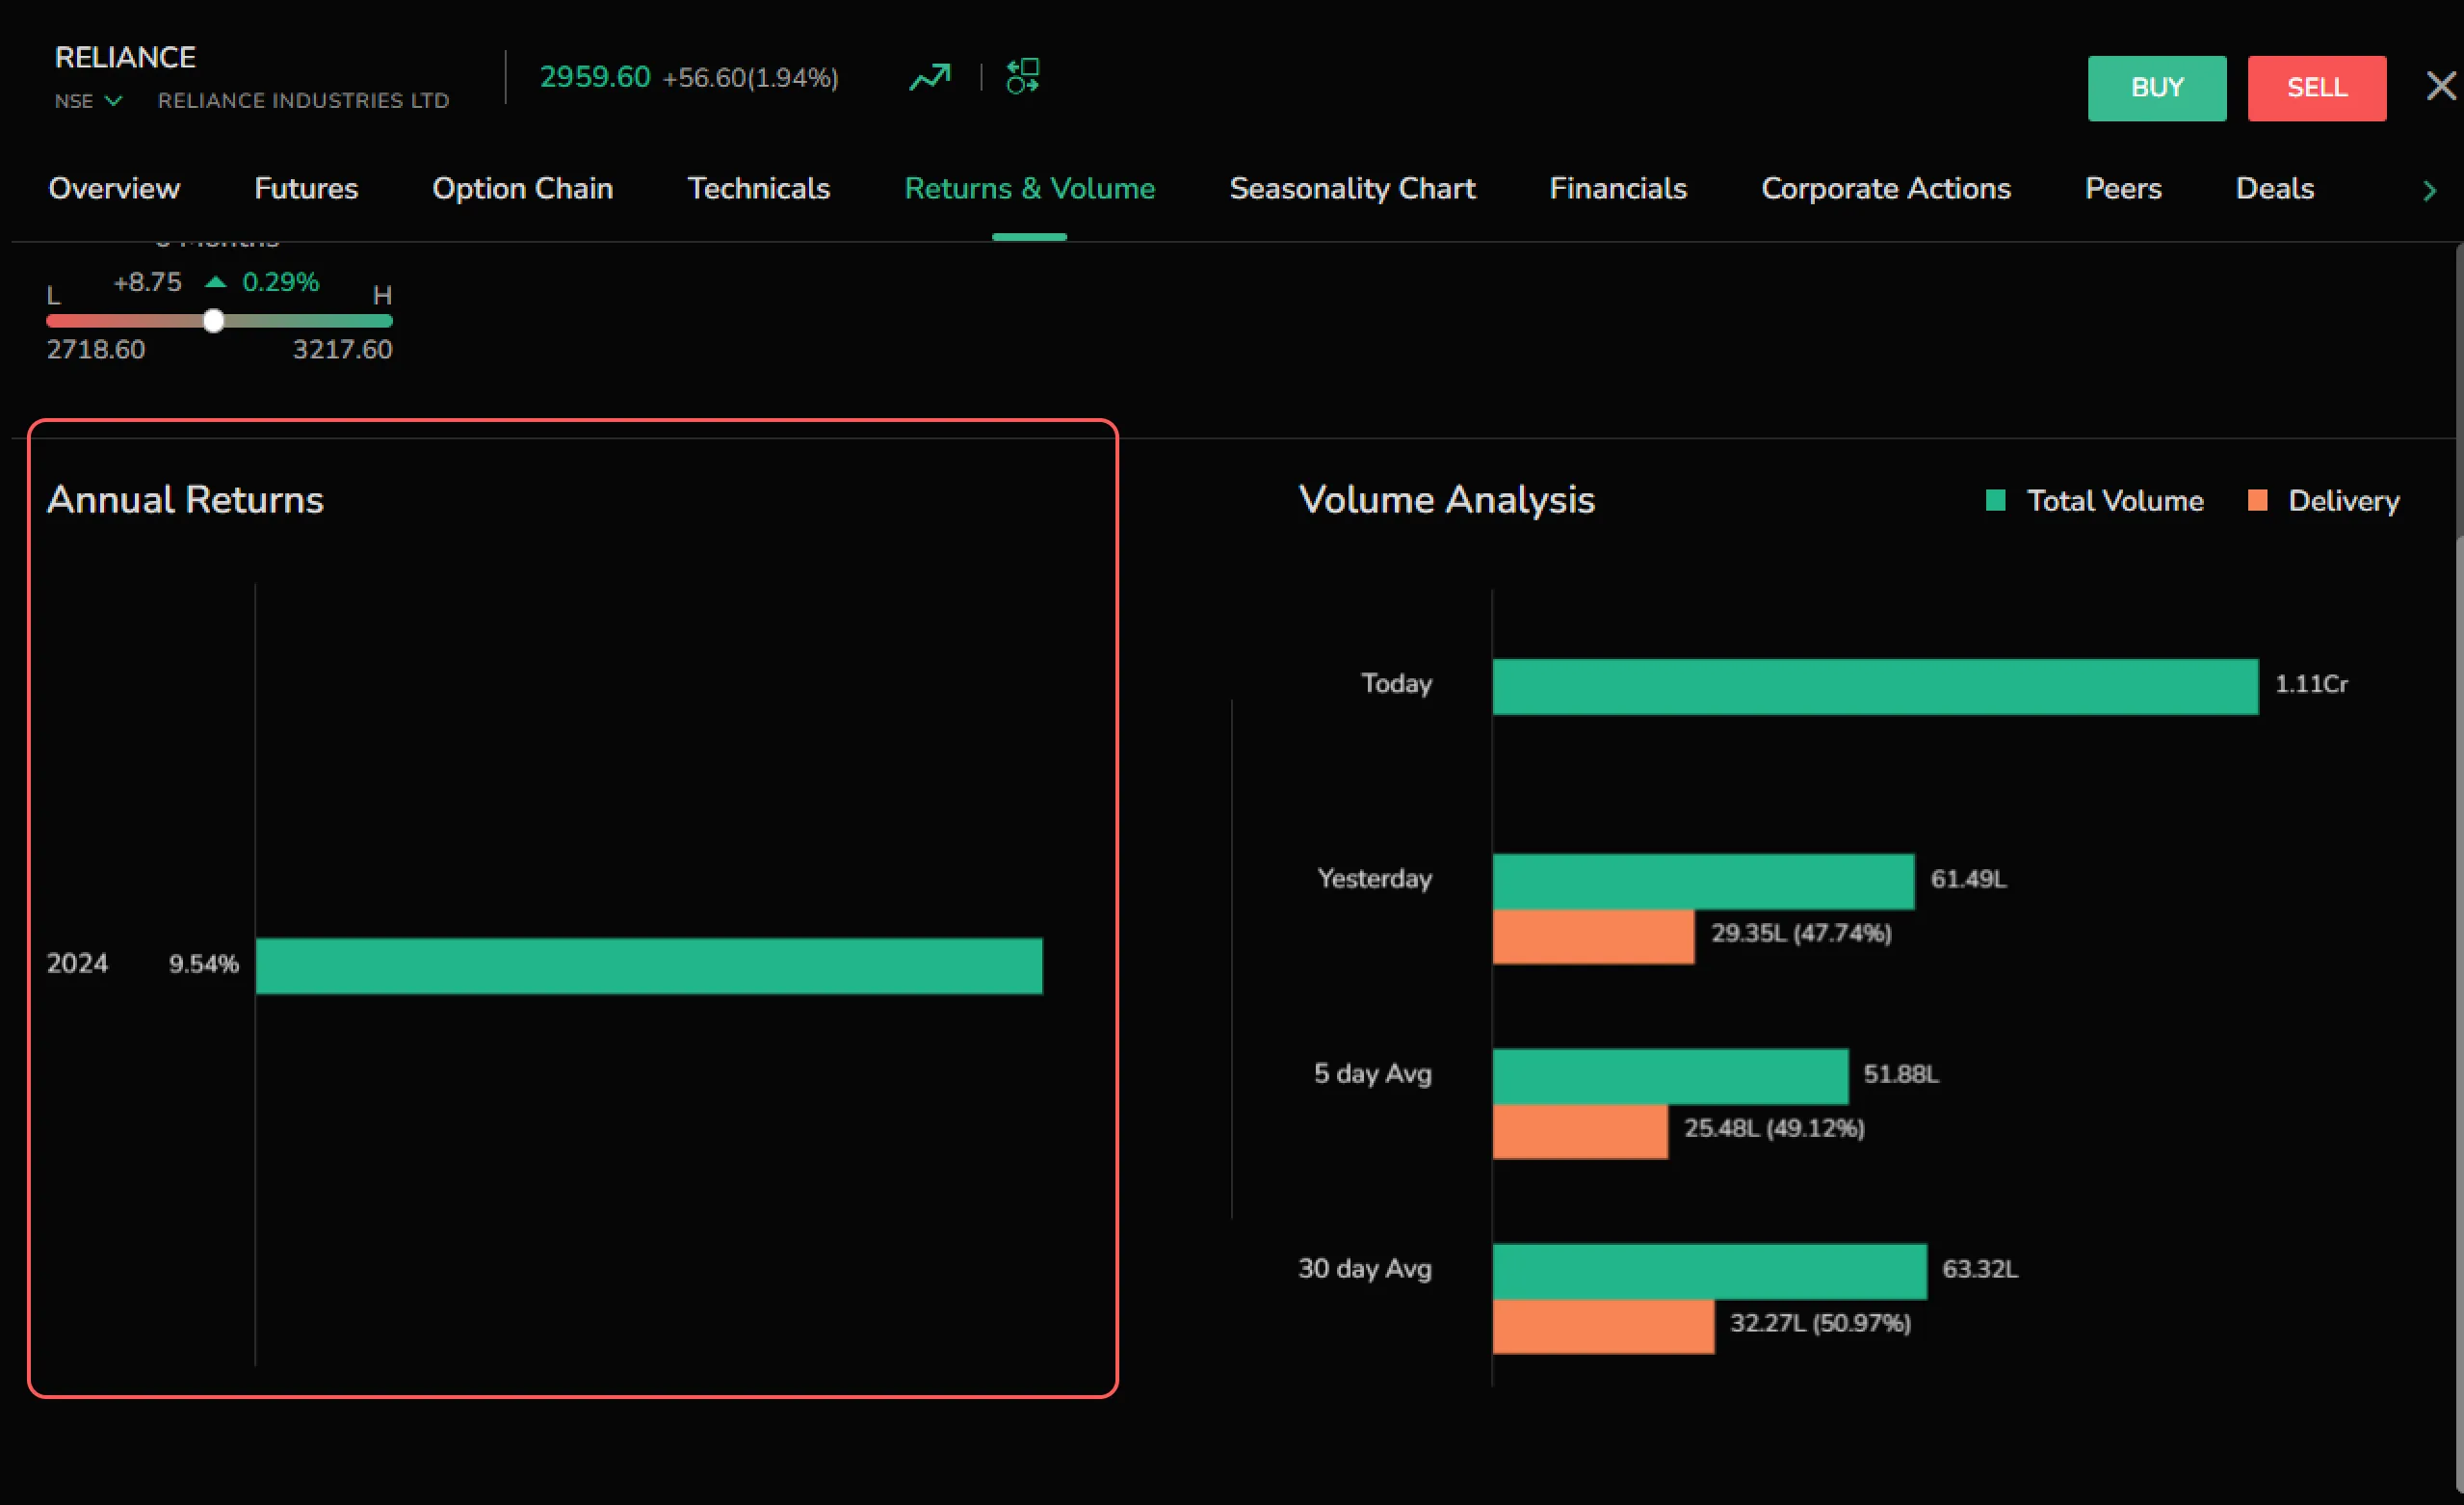
Annual Returns
Annual returns for the past five years are displayed in a horizontal bar graph, with green and red bars representing percentage changes.

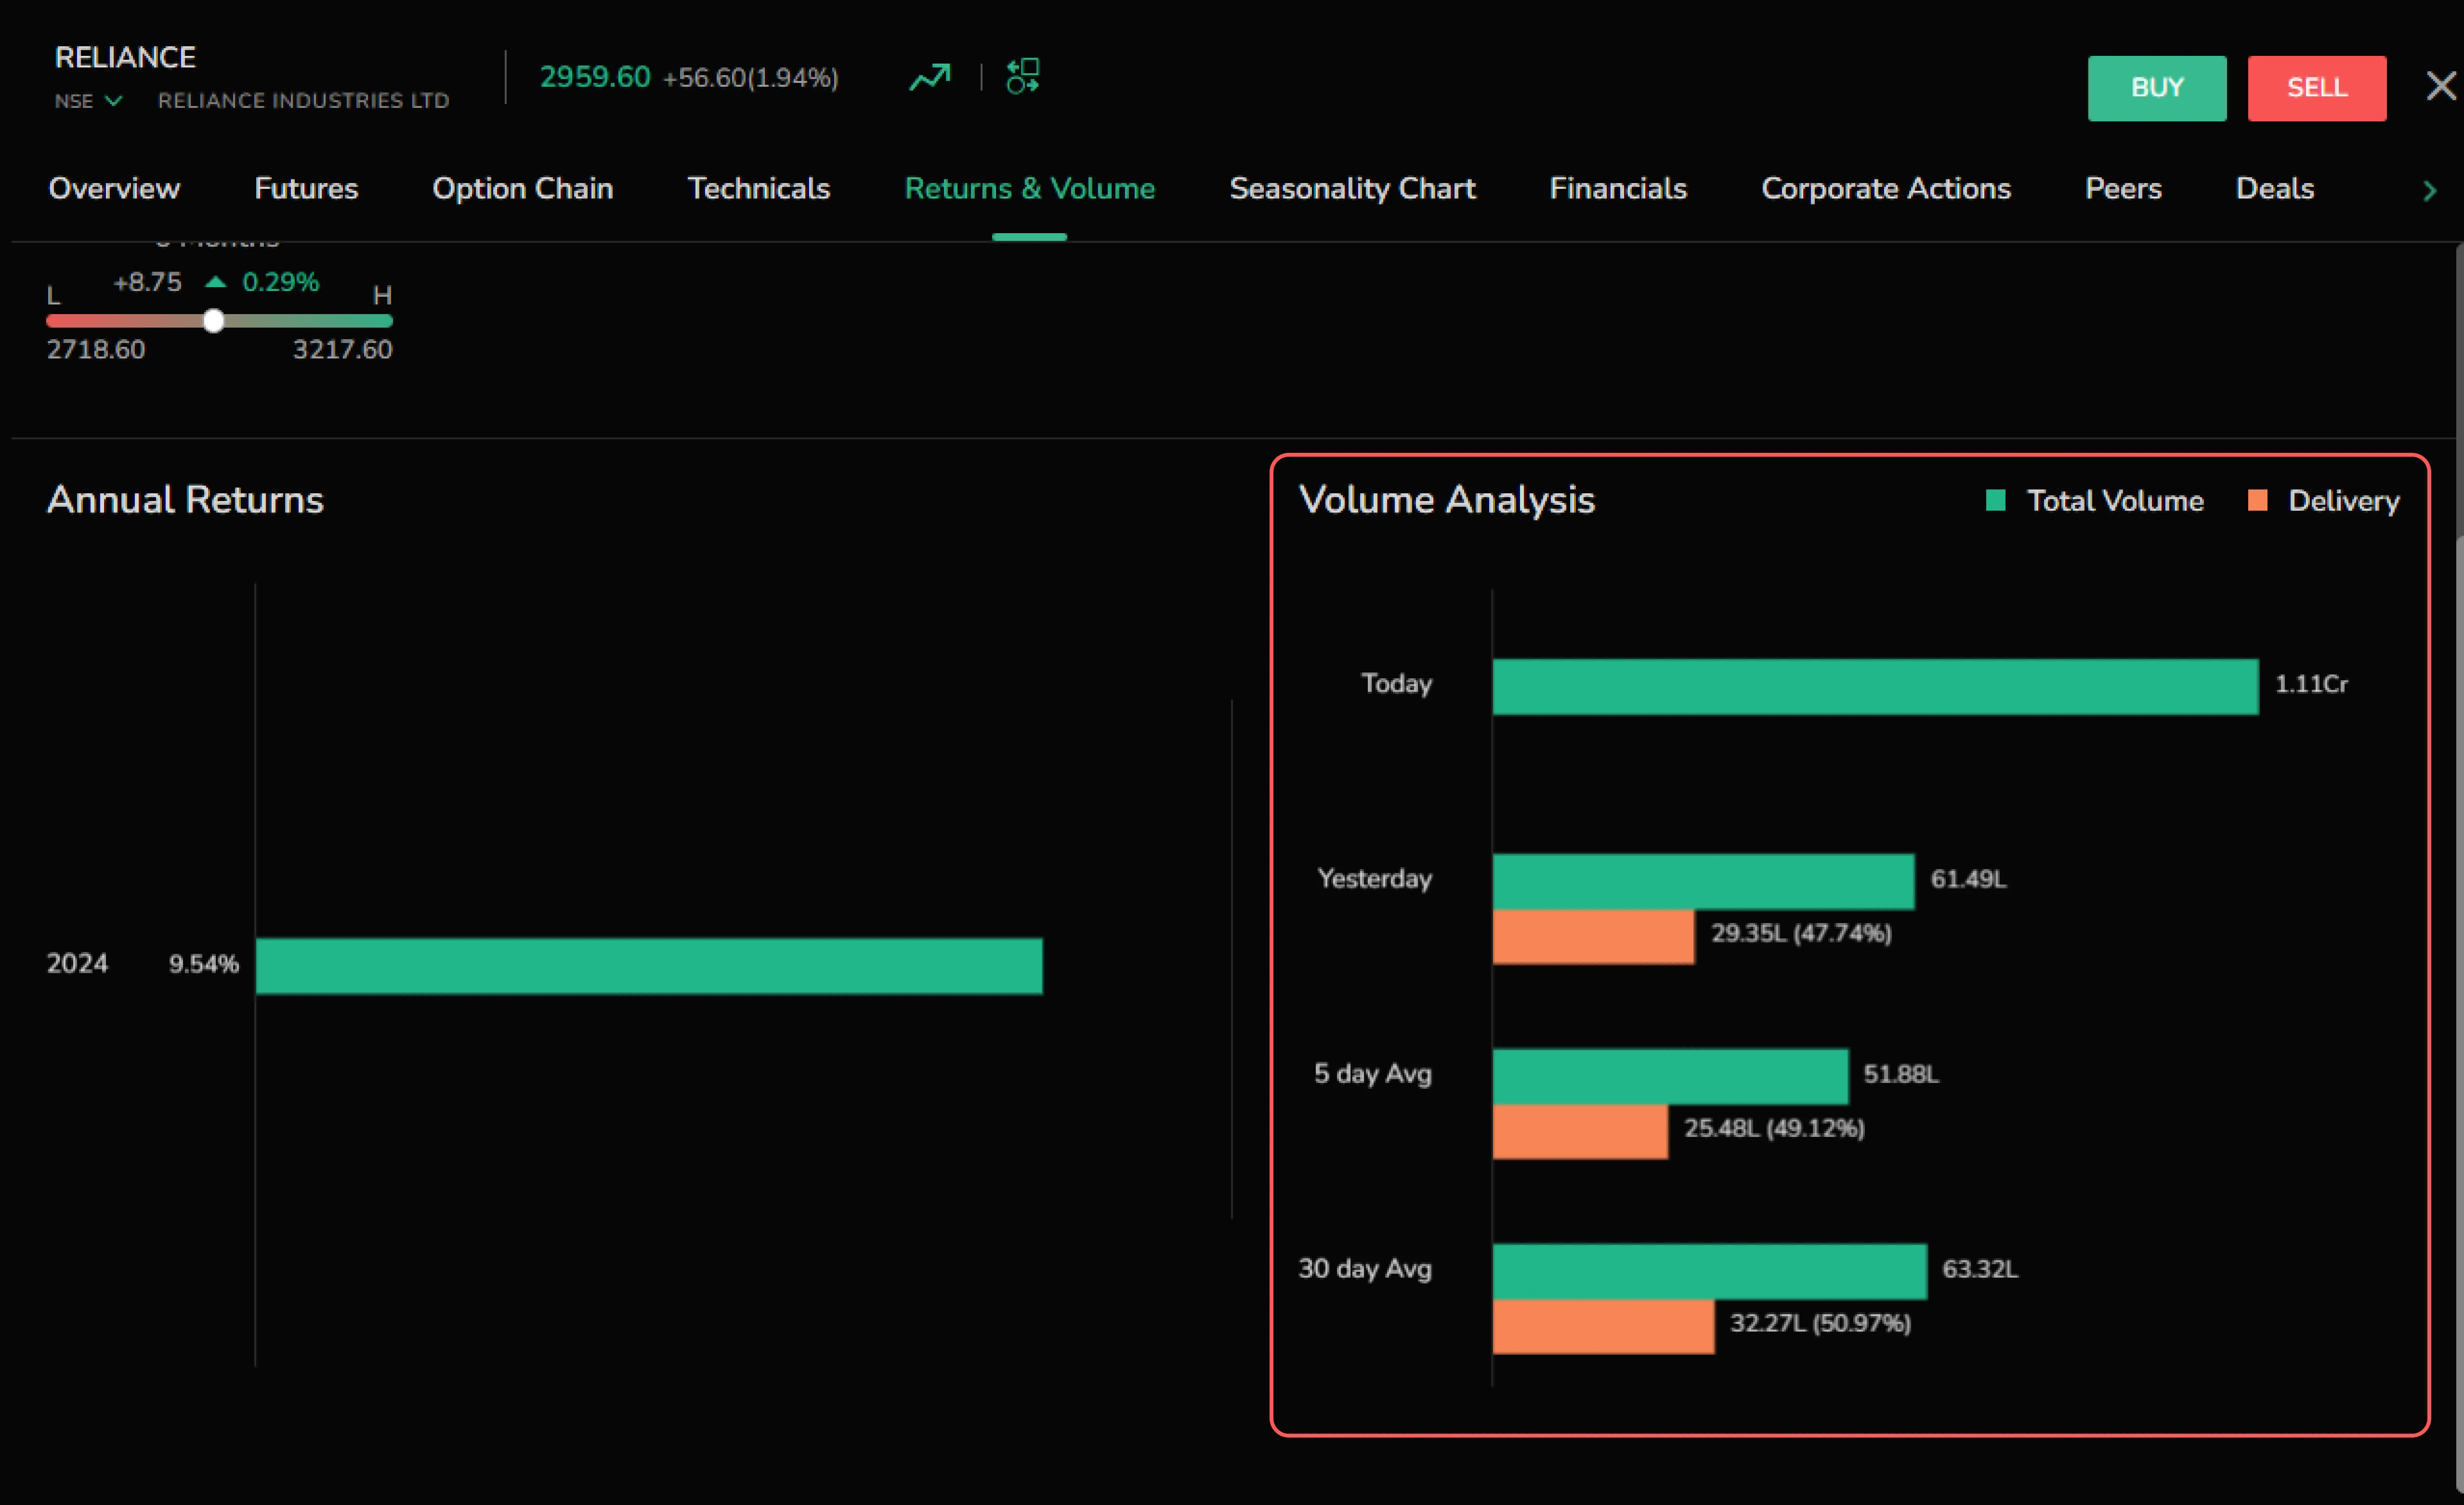
Volume Analysis
This shows total volume and delivery for today, yesterday, the 5-day average, and the 30-day average.
- Total Volume: Indicates the total number of shares traded.
- Delivery: Represents the number of shares traded resulting in Delivery.
A horizontal bar graph visually compares these two metrics.
