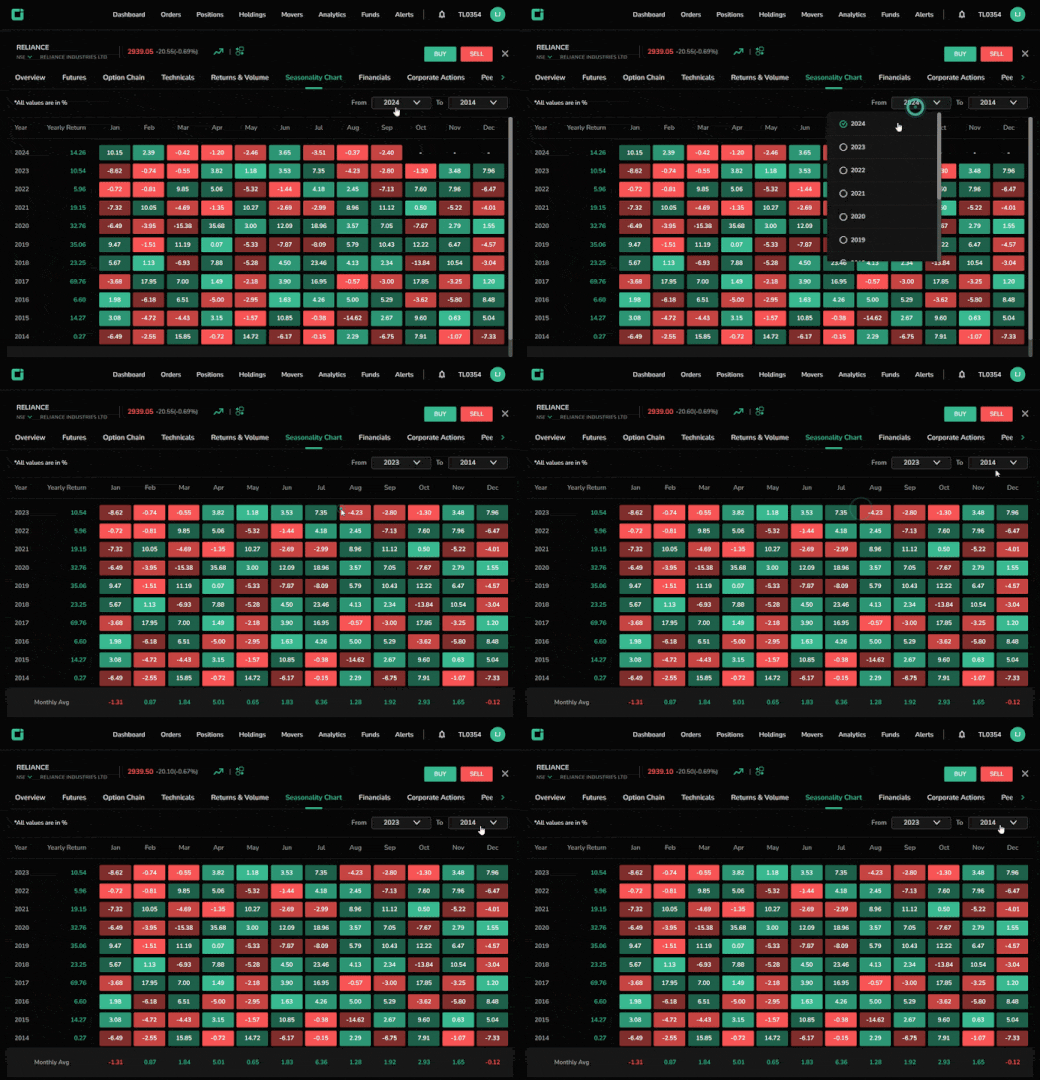
Seasonality Chart
A seasonality chart monitors the price movement of a stock or index throughout the year using historical data, emphasizing recurring patterns for each month.
It illustrates a stock’s typical performance during different periods over several years, offering a visual representation of consistent seasonal trends.
Access Seasonality Chart
Navigate to Seasonality Chart from the Quotes page.
Seasonality Chart Functionalities
Upon opening, a 10-year seasonality chart is displayed by default. Customize the time frame by selecting specific years in the 'From' and 'To' fields, with values shown in percentages.
Green boxes indicate positive values, red signifies negative values, and grey represents neutral ones. The color intensity varies according to the strength of the values.
Users can view:
- Yearly returns
- Monthly returns
- Monthly average returns
