Mutual Funds
On the Web
Dashboard
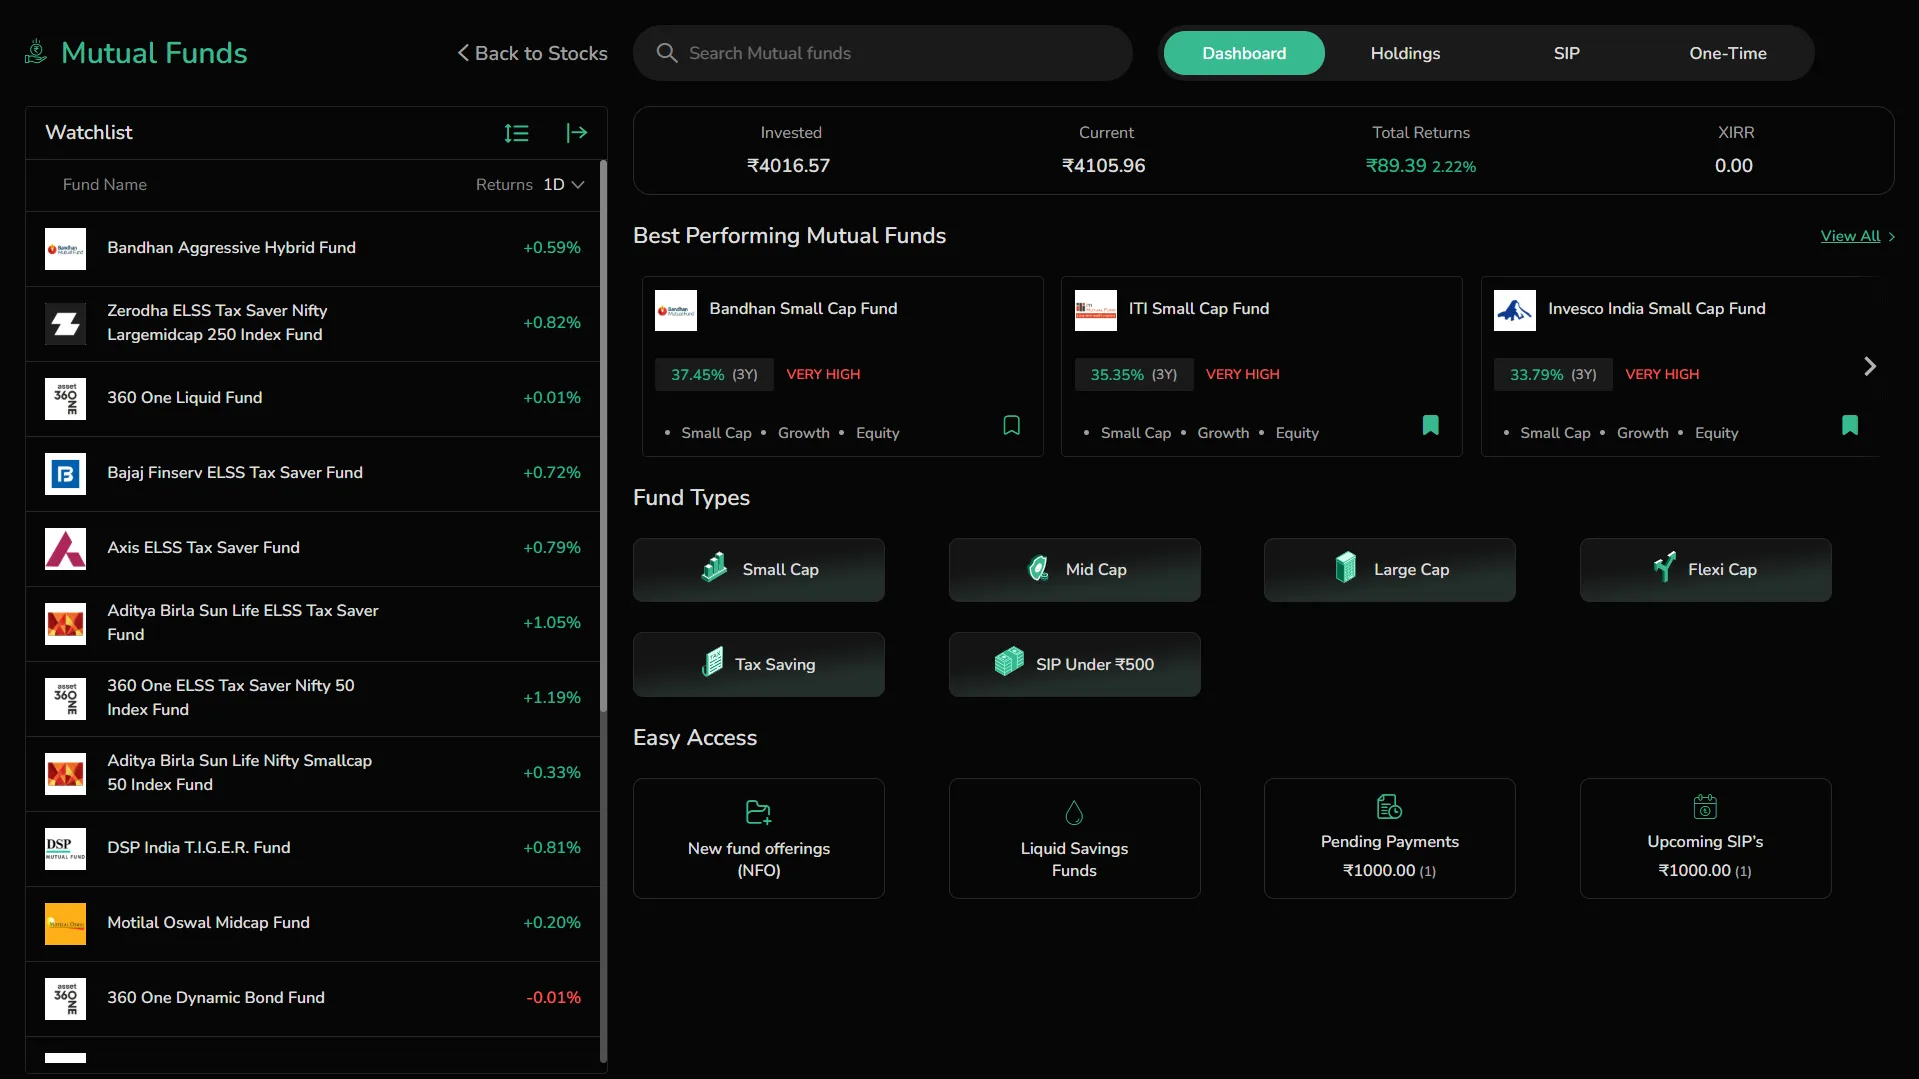
The Dashboard is the default landing screen under the Mutual Funds section in CubePlus. It provides a consolidated overview of your investments and offers quick access to explore and invest in mutual funds based on category, popularity, or strategy.
Overview
- Search bar at the top to look up mutual fund schemes by name or type.
Tabs at the top-right to switch between:
- Dashboard – current screen
- Holdings – view invested funds
- SIP – active and upcoming SIPs
- One-Time – lump-sum order history

Summary panel at the top shows a quick snapshot of your portfolio status:
- Invested = Total amount invested – The cumulative amount of your investment held across all mutual funds.
- Current = Current value of all holdings – Real-time portfolio value based on the latest available NAVs.
- Total returns (₹ and %) – Shows both absolute returns in rupees and percentage gain/loss.
- XIRR (Extended Internal Rate of Return) – A time-weighted annualized return metric that considers both the amount and the timing of your investments and redemptions.
It helps provide a more accurate picture of how your money has grown over time, especially if you’ve made multiple investments or withdrawals at different intervals.
This panel helps you understand how your overall mutual fund investments are performing at a glance, without needing to navigate into individual holdings.
Key Sections
-
Watchlist You can add the funds to the watchlist to track. This section displays the fund name with logo, and recent returns. Use the sort and filter icons to organize or rearrange the list:
-
Returns dropdown lets you change the period to view % change over 1 Day, 1 Week, 1 Month, 3 Months, 1 Year, 3 Year or 5 Years
-
Sort options allow you to sort funds by:
-
Name – Alphabetically (A–Z)
-
Return % – Based on percentage change for the selected period (in expanded watchlist)
-
-
Click the expand icon to switch between compact and full view of the watchlist. You can customize up to 8 columns by selecting from a wide array of options under CAGR, Annual Returns, SIP Returns, Risk, NAV & Fees2

- Best Performing Mutual Funds
Highlights top-performing mutual funds over a 3-year period along with their risk profile (e.g., "VERY HIGH"). Displays fund details such as Growth, Equity, Small Cap etc. Click the bookmark icon to add or remove a fund from your Watchlist.
- Fund Types
One-click filters to browse funds by investment style or goal:
-
Small Cap – These funds invest in companies with smaller market capitalization, typically below the top 250 listed stocks. They have high growth potential but come with higher volatility.
-
Mid Cap – Mid Cap funds focus on companies ranked roughly between 101 and 250 in terms of market cap. These offer a balance between risk and reward, with greater stability than small caps.
-
Large Cap – Invests in the top 100 companies by market capitalization. These are generally stable, well-established businesses and are suited for conservative investors.
-
Flexi Cap – These are diversified funds with no restriction on market cap allocation. The fund manager has the flexibility to invest across large, mid, and small cap stocks as per market conditions.
-
Tax Saving (ELSS) – Equity Linked Savings Schemes offer tax benefits under Section 80C. They have a 3-year lock-in period and invest predominantly in equities.
-
SIP Under ₹500 – Curated list of schemes that allow SIPs starting below ₹500, ideal for first-time investors or those looking to start small.
-
Easy Access Quick links to actionable fund categories:
-
New Fund Offerings (NFO)
-
Liquid Savings Funds
-
Pending Payments – orders placed but payment not yet completed
-
Upcoming SIPs – future scheduled auto-debits
Holdings
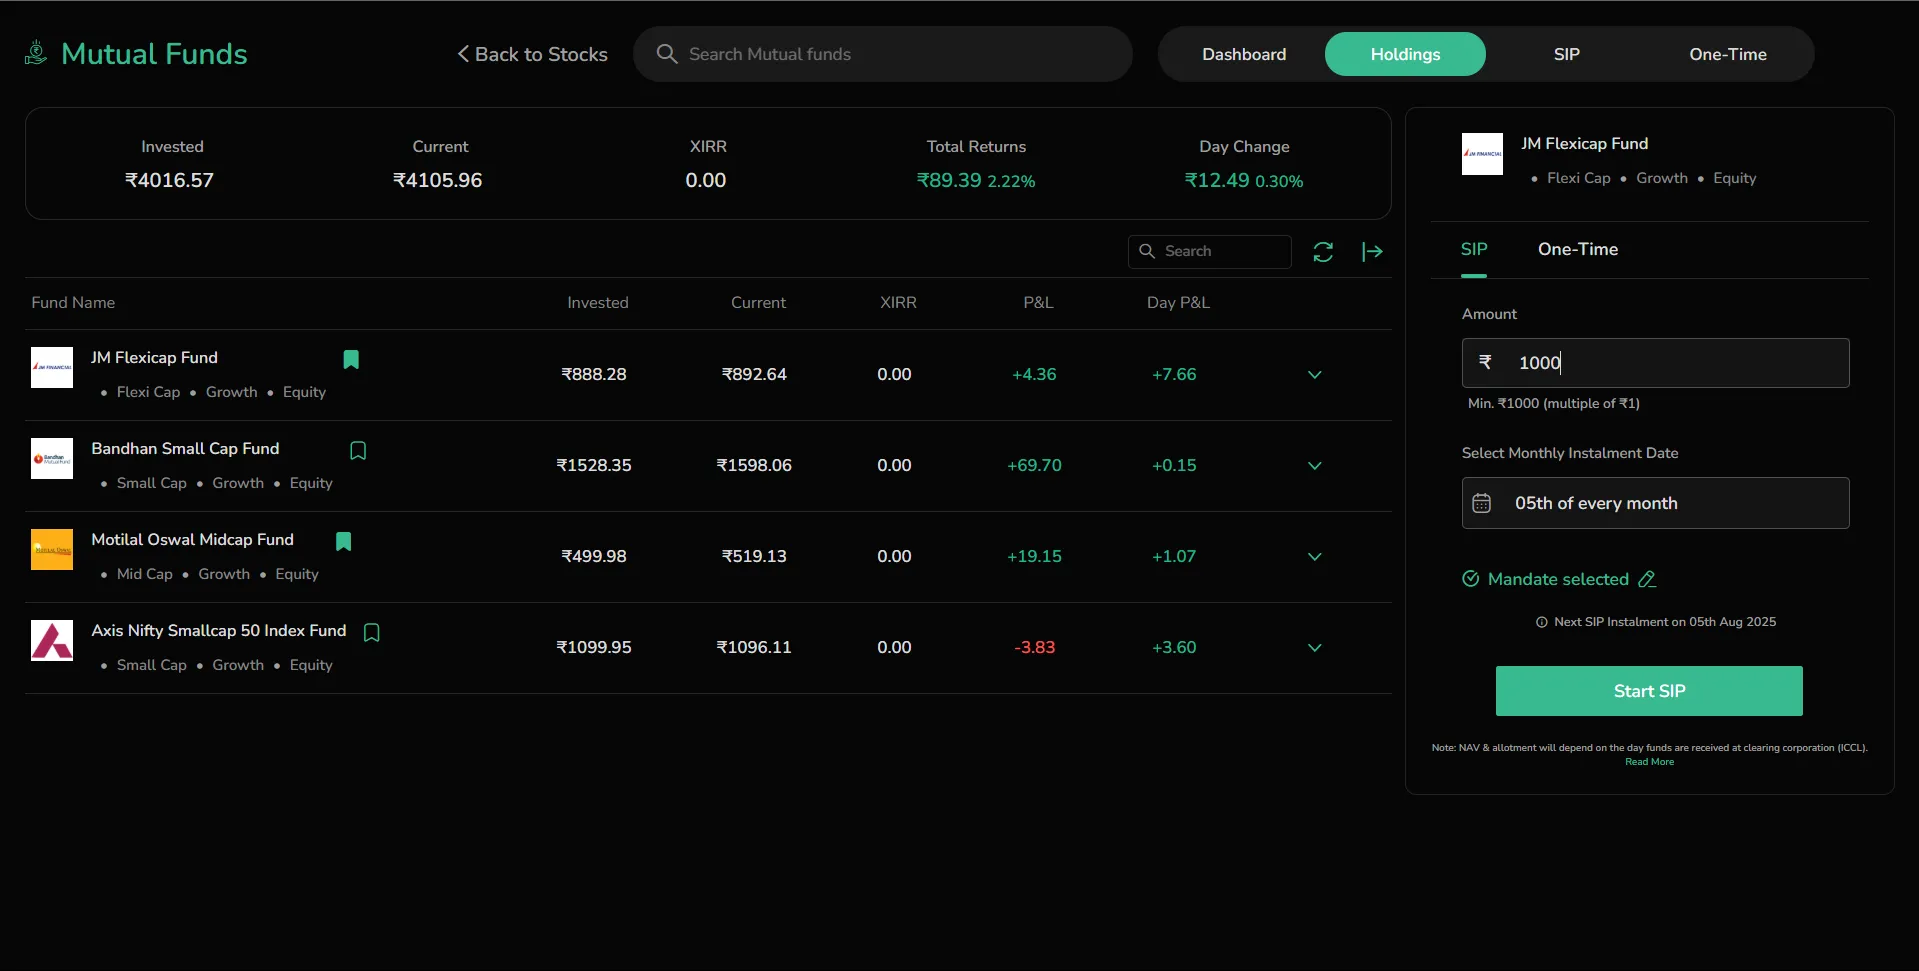
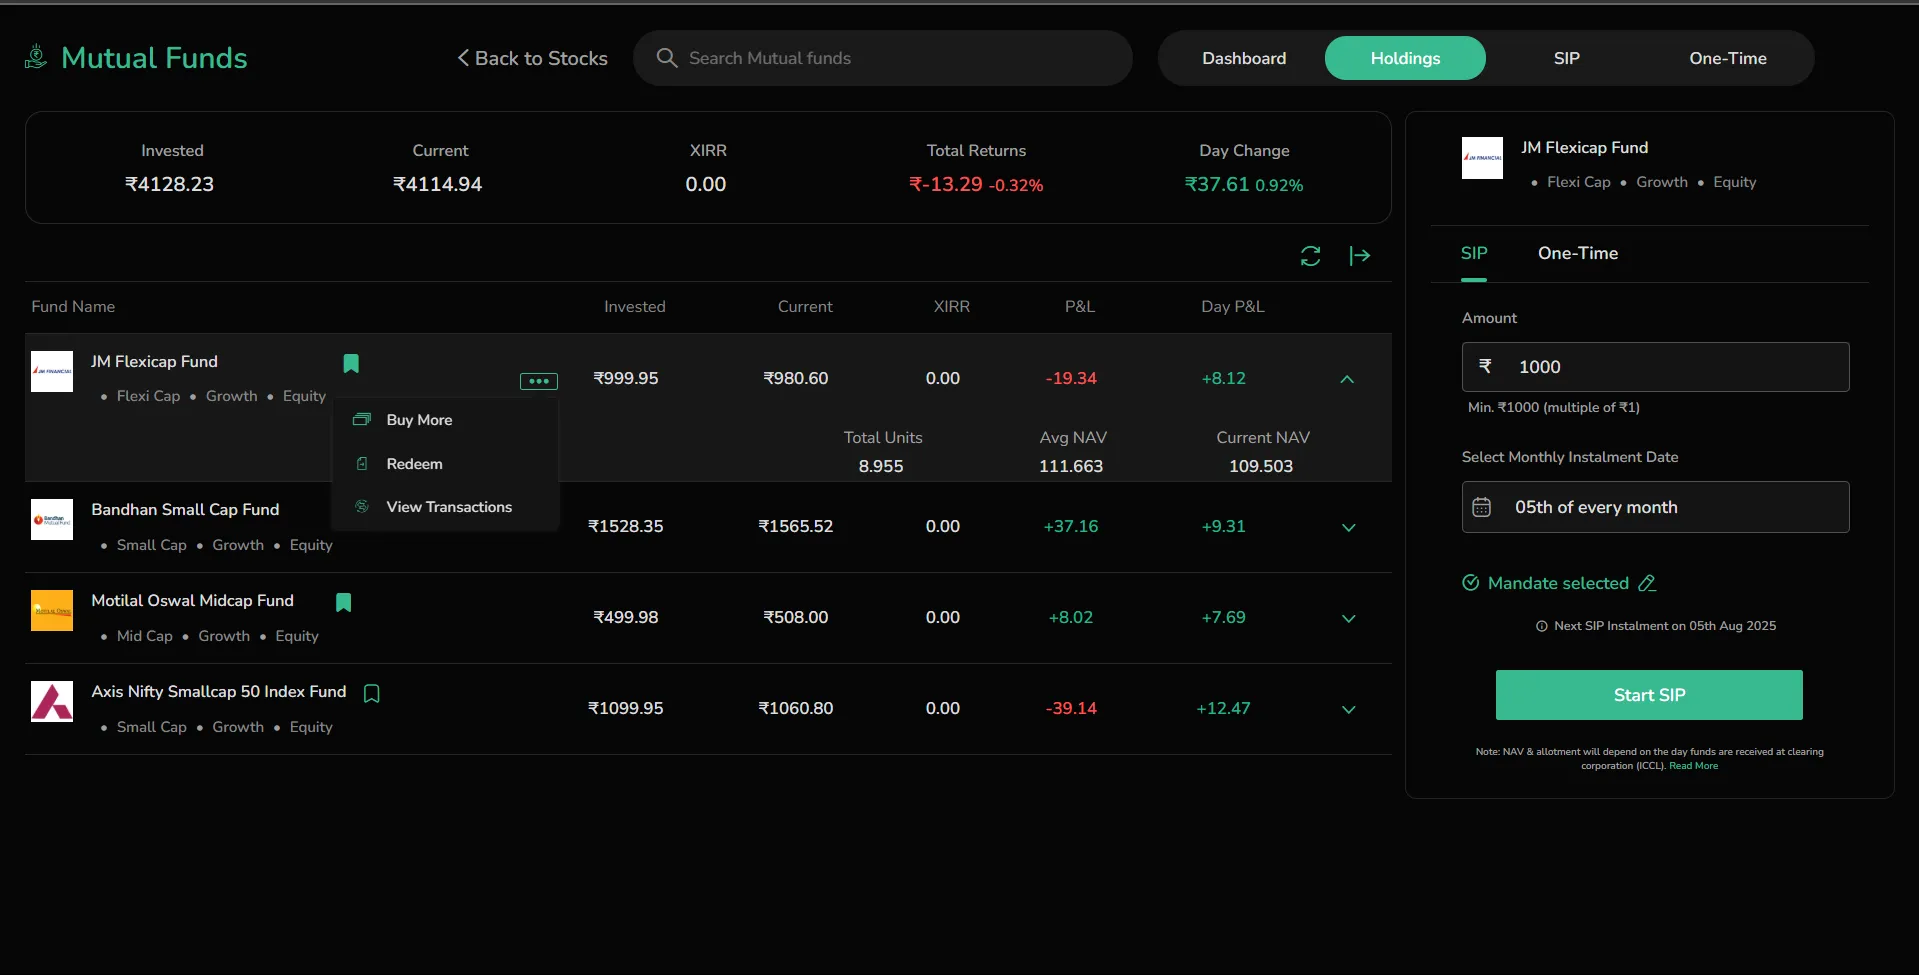
The Holdings tab displays all mutual fund investments currently held in your demat account. This section provides a break up of individual fund performance and gives a consolidated view of your portfolio.
Overview
-
Top Summary Panel shows:
-
Invested – The total amount of money you’ve invested across all mutual fund orders. This includes both SIPs and one-time investments, regardless of whether the units are currently profitable or not. It reflects the actual capital you’ve deployed for your current holdings.
-
Current – The present-day market value of your entire mutual fund portfolio based on the latest available NAVs. It updates automatically to reflect real-time fund valuations.
-
All-Time Returns – This is the profit or loss generated so far. It is displayed both in rupees and as a percentage. This gives you a clear sense of how your portfolio is performing in absolute terms.
-
XIRR (Extended Internal Rate of Return) – An advanced return metric that calculates the time-weighted annual return on your investments. It takes into account the timing and amount of every investment and redemption, offering a more realistic view of long-term performance.
-
Day Change – Indicates the change in market value (₹ and %) of your portfolio for the last one trading day (This change is usually between yesterday and day before yesterday). This helps you track how your portfolio fluctuated in the short term due to market movement.
This panel acts as your one-glance health check of how your mutual fund investments are performing overall.
Holdings Breakdown
Each fund in your portfolio is listed with:
-
Fund Name
-
Fund Type (e.g., Growth, ELSS, IDCW)
-
Amount Invested – The capital you’ve allocated to that particular scheme.
-
Current Value – The real-time worth of your investment based on the latest NAV.
-
Net P&L – Your gains or losses in rupee terms and percentage.
-
Drop-down toggle – Expands to show detailed transaction-level data, such as purchase NAV, units held, and transaction history.
This section allows you to dig into fund-specific performance and make informed decisions about holding or redeeming your investments.
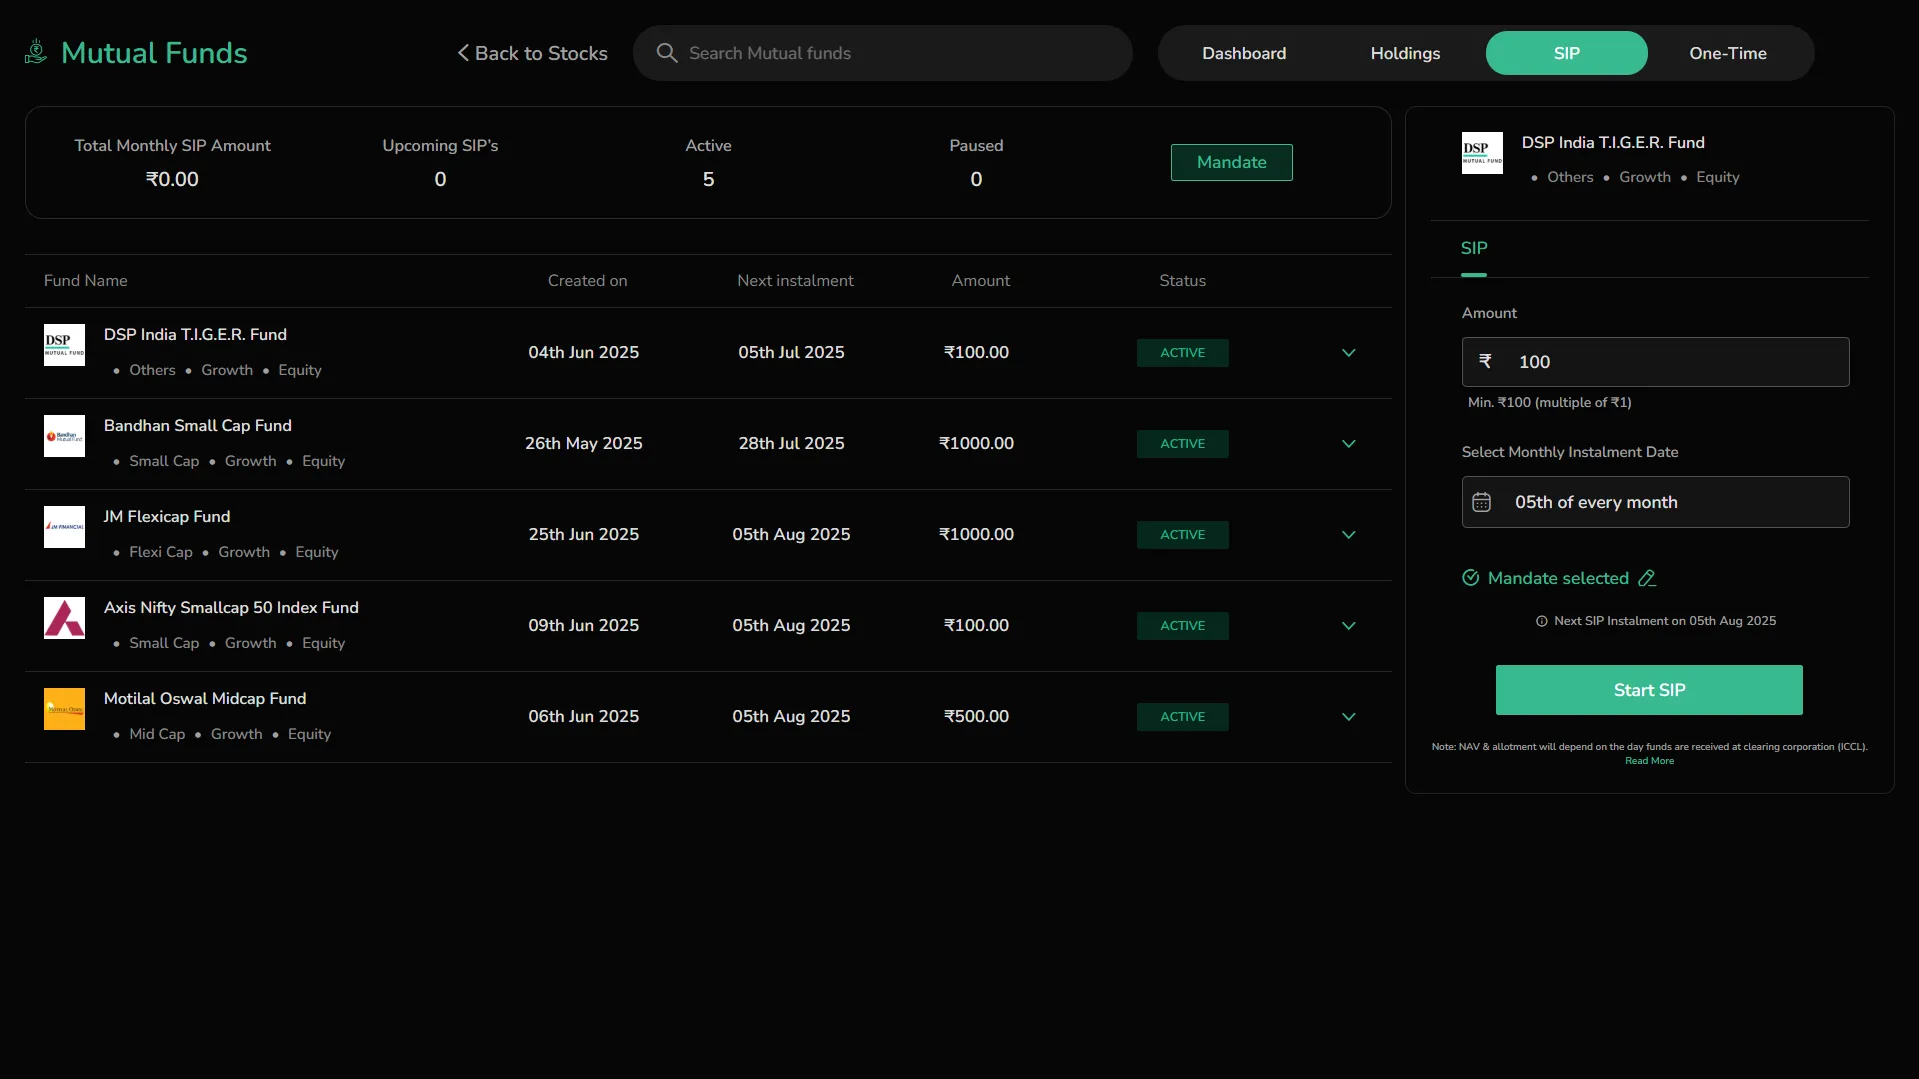
SIP
The SIP tab in CubePlus allows you to manage all your active and upcoming Systematic Investment Plans (SIPs) in one place. This view gives a clear picture of your SIP activity, upcoming installments, and the funds requirement associated with them.
Overview
-
Navigation Tabs at the top help switch between Dashboard, SIP, Holdings, and Orders.
-
Search bar enables quick lookup of fund names.
-
SIP Status Panel displays counts of:
-
Active – Ongoing SIPs with auto-debit enabled
-
Paused – SIPs that have been manually paused
SIP Details Table
Each SIP listed displays important information to help you track and manage your ongoing and upcoming investments:
-
Fund Name – The name of the mutual fund scheme in which the SIP has been initiated.
-
Fund Type – Describes the scheme's nature, such as Growth (no dividend payout), ELSS (tax-saving category), or IDCW (dividend plan), along with whether it's equity or debt-oriented.
-
Status – Indicates the current operational state of the SIP:
-
ACTIVE – The SIP is live and scheduled for upcoming auto-debits.
-
PAUSED – The SIP has been temporarily halted. No auto-debits will be initiated until it is resumed.
-
Next Installment – The upcoming date when the SIP amount will be debited from your bank account.
-
Frequency – SIPs in CubePlus are executed on a Monthly basis only.
-
Amount – The fixed amount that will be invested in the fund during each SIP cycle.
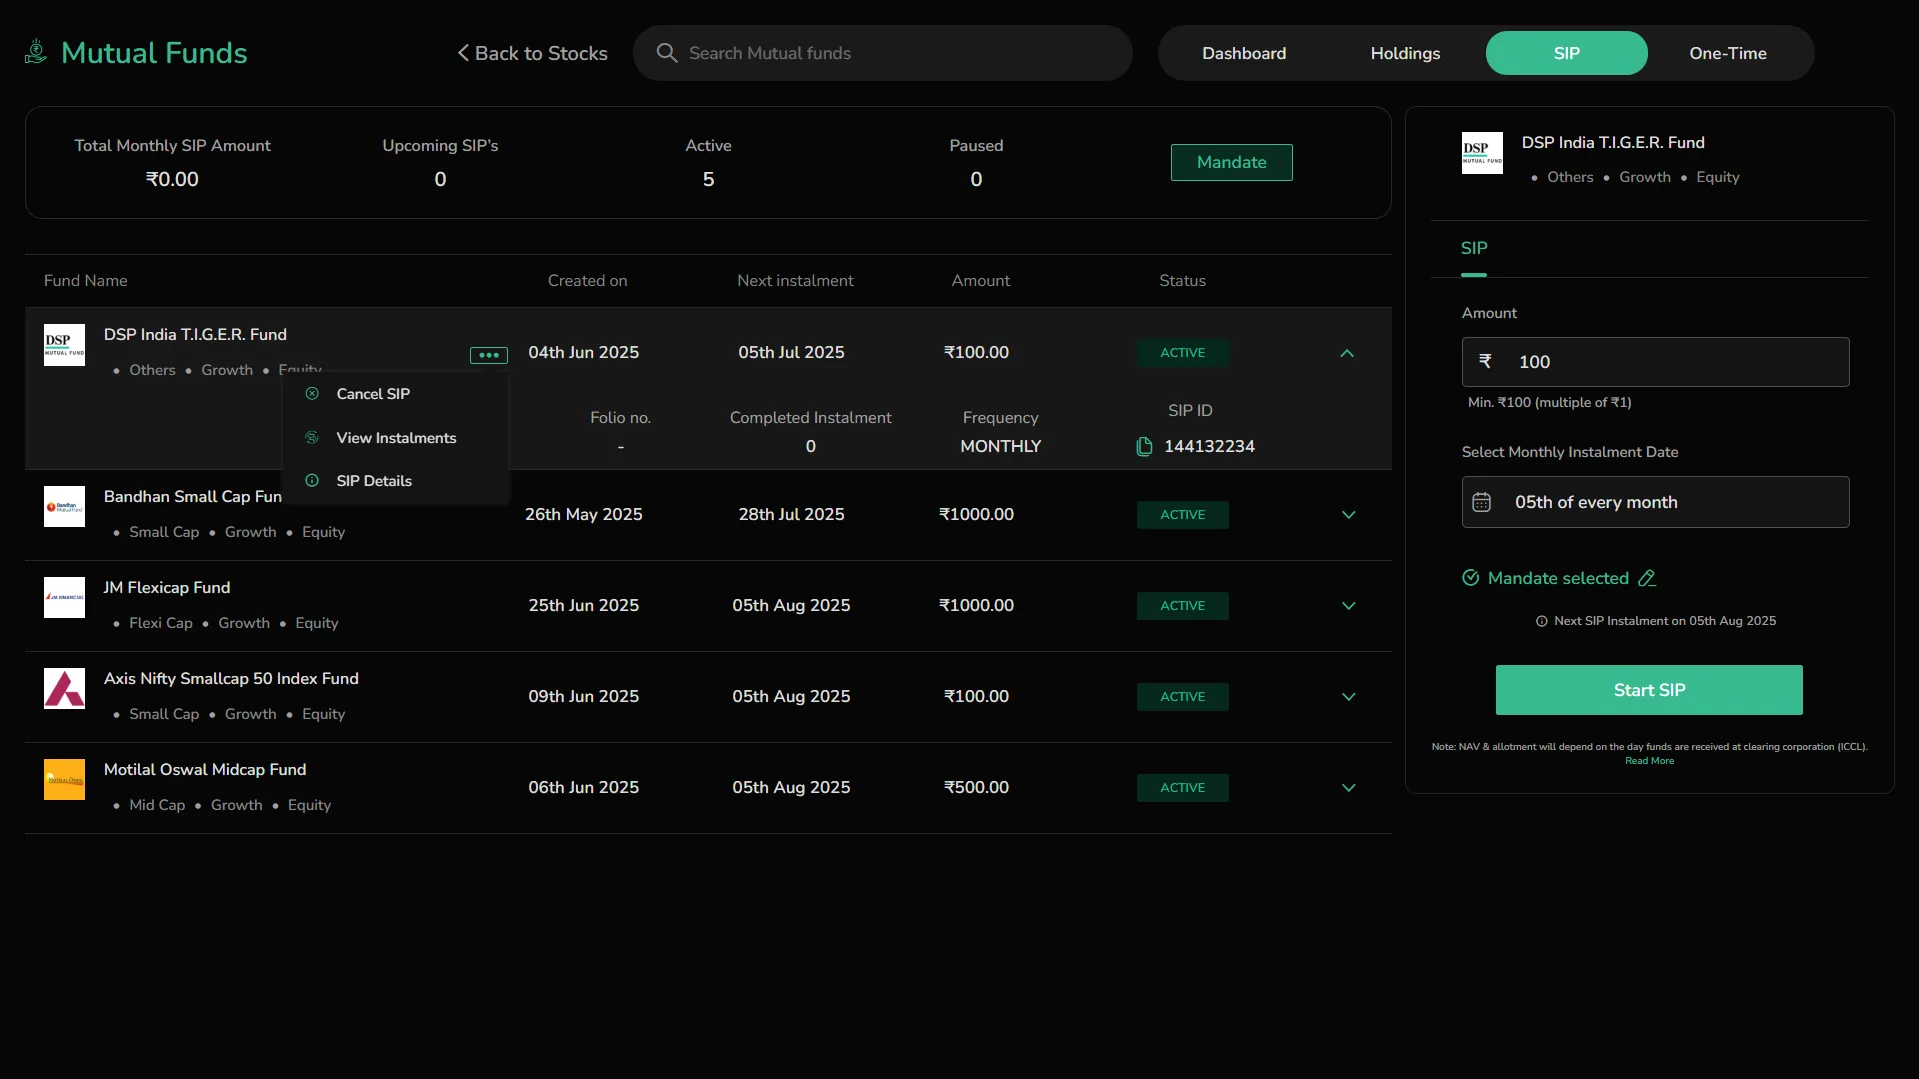
Click the dropdown arrow on the right to view the following additional SIP details:
-
Created On – Date on which the SIP was initiated.
-
Folio Number – Unique identifier assigned to your mutual fund holdings (if applicable).
-
Completed Installments – Number of SIP cycles that have been successfully executed.
-
Frequency – Confirmed as Monthly in all cases.
-
SIP ID – A unique reference number for tracking your SIP registration.
These additional data points help you verify the setup, track history, and manage SIPs efficiently.
Use the drop-down arrow on the right to access further actions or view installment history (if available).
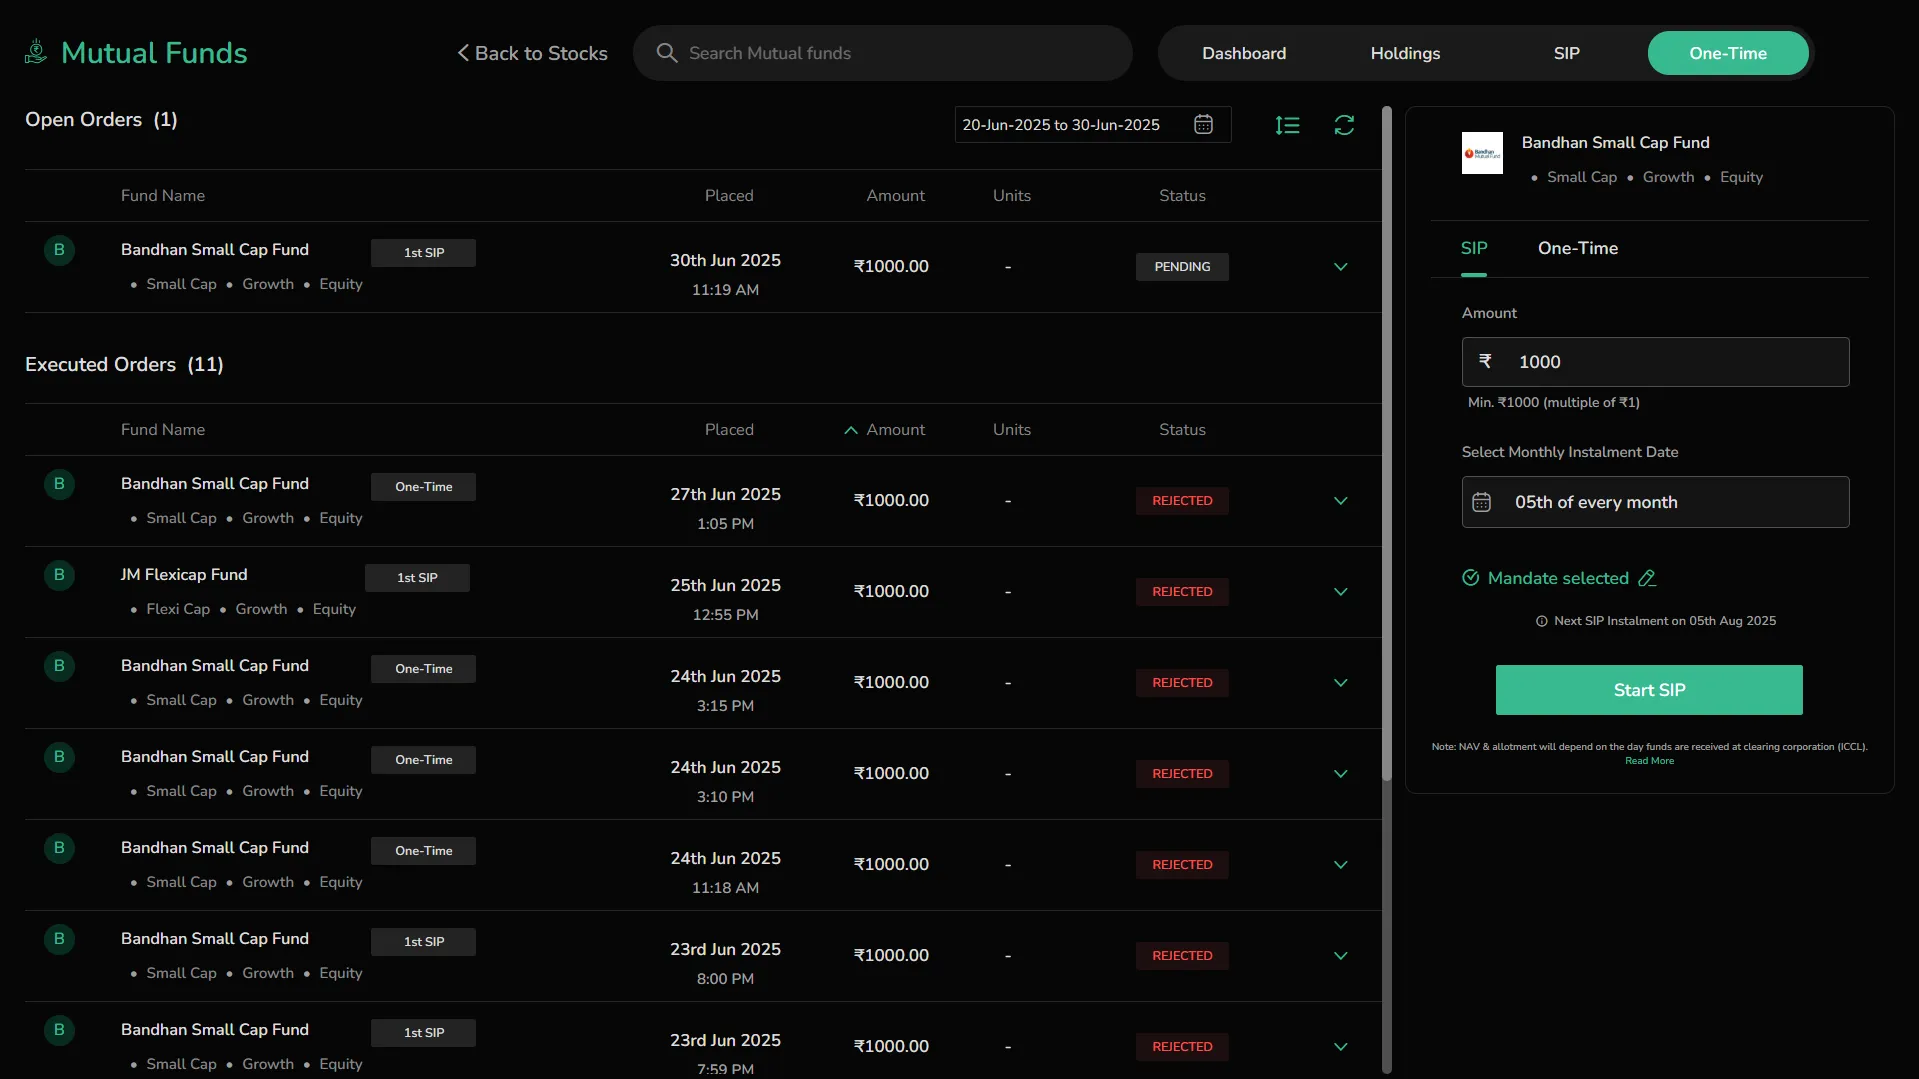
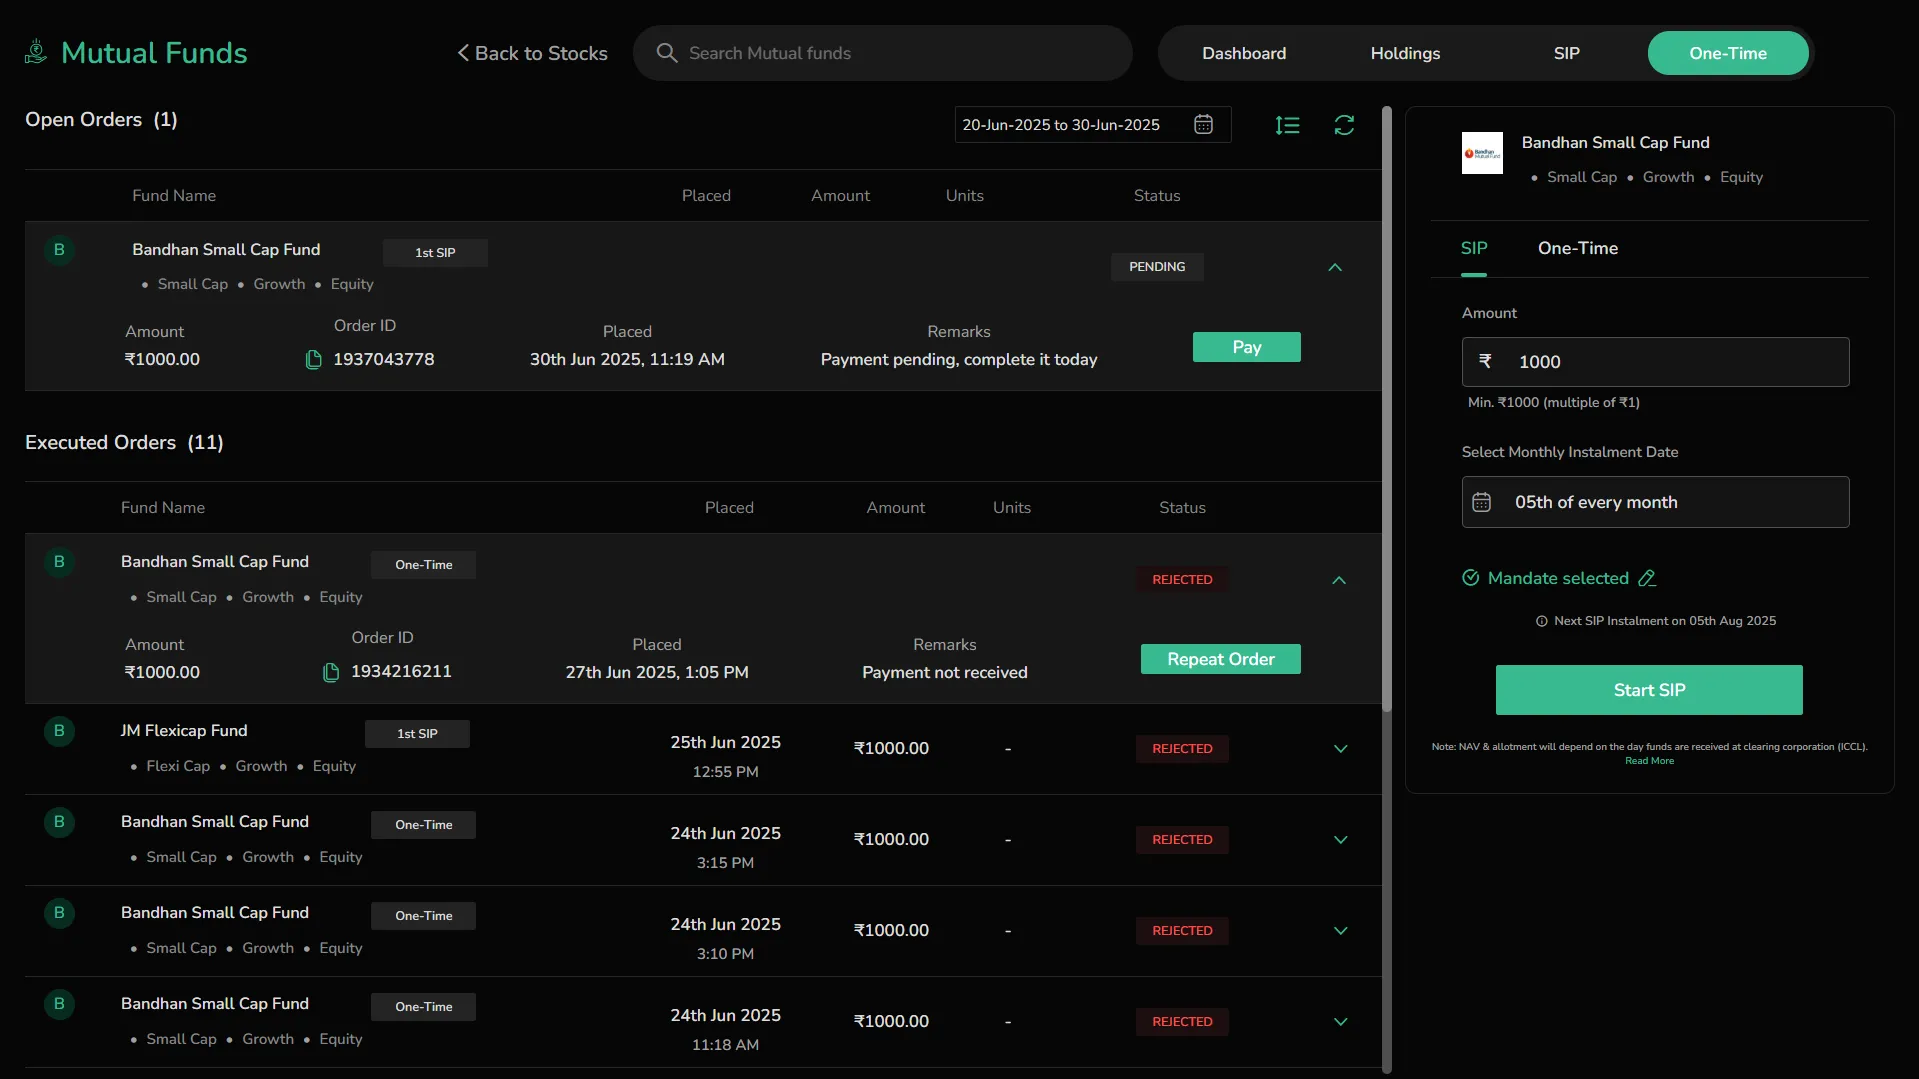
One-Time Orders
The One-Time tab in CubePlus lets you view all lump-sum investments into mutual fund schemes including the 1st instalment of created SIP. It also provides a complete view of your executed and pending one-time orders.
Overview
-
Navigation Tabs at the top help switch between Dashboard, SIP, Holdings, and One-Time.
-
Search bar allows you to look up mutual fund schemes for quick selection.
-
Date filter helps narrow down orders by execution or placement date.
-
Transaction Type Filter enables users to toggle between viewing:
-
ALL – Displays both buy and sell orders
-
BUY – Filters to show only purchase transactions
-
SELL – Filters to show only redemption or sell orders
Order Sections
-
Open Orders – Displays SIPs or one-time orders that have been placed but not yet processed. Each row shows:
-
Fund Name and Tag – Displays the official name of the mutual fund scheme along with a tag that indicates the type of transaction being processed. For example, "One-Time" shows that it is a standalone investment, while "1st SIP" marks the first installment of a newly set up SIP.
-
Fund Type – Shows the category and approach of the selected fund. This typically includes whether it’s a Growth plan (no dividend payouts), the asset class (e.g., Equity), and its market cap focus (e.g., Small Cap, Mid Cap).
-
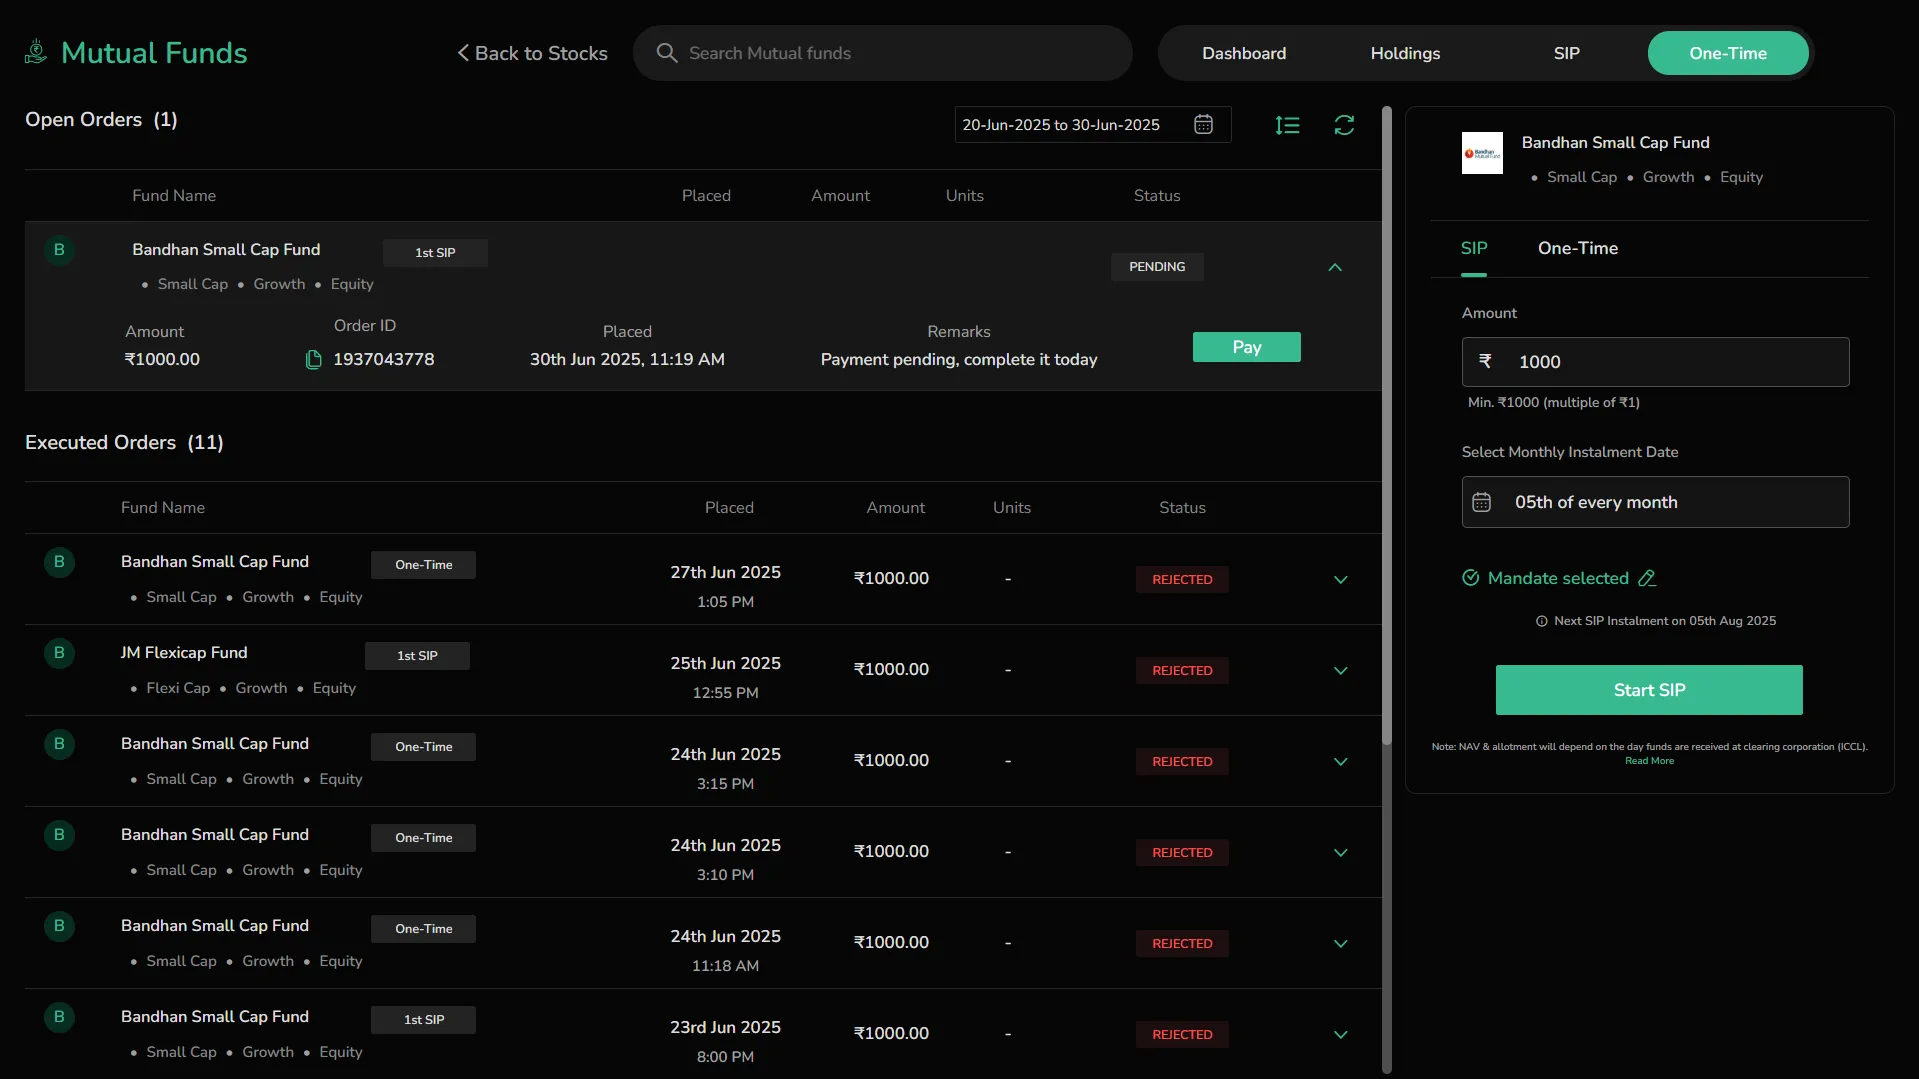
Status – Indicates the processing state of the order. "PENDING" means the order has been placed but is awaiting confirmation. Other possible statuses may include "COMPLETED" or "REJECTED" depending on fund reception and processing.
-
Order ID – A unique identification number assigned to each order. This ID is copyable and helps in referencing the specific order in case of queries, support tickets, or audits.
-
Placed – Shows the exact date and timestamp when the order was submitted on the platform. Useful for matching against payment and allotment timelines.
-
Amount – Displays the value entered by the investor for the transaction. This is the lump-sum investment intended for that order.
-
Remarks – Contextual information added by the system based on payment behavior or transaction issues, such as "Payment received" or "Payment not received".
-
Click the dropdown arrow to expand and view detailed order information.
-
Executed Orders – Shows all past orders, whether successful or failed. Each row displays:
-
Fund Name and Type
-
Investment Mode (SIP or One-Time)
-
Amount Invested
-
Order Placement Date and Time
-
Order ID (clickable copy icon)
-
Status (e.g., SUCCESS, REJECTED)
-
Remarks (e.g., "Payment not received")
-
Repeat Order button to quickly place the same investment again
Placing Orders
CubePlus allows investors to place both SIP and One-Time orders directly through a streamlined and intuitive flow. This section explains the complete process for each investment type.
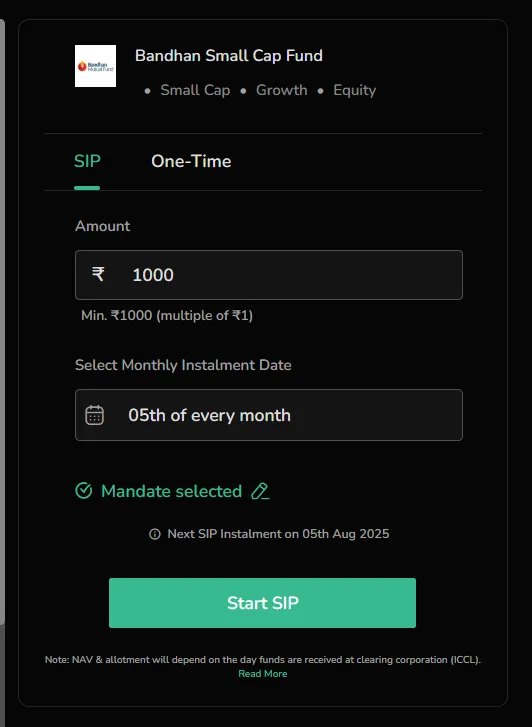
SIP Order Placement
Step 1: Fill SIP Order Details
-
Select a mutual fund and switch to the SIP tab.
-
Enter the SIP amount. The minimum amount is ₹100, and it must be in multiples of ₹1 and varies from fund to fund.
-
Choose a Monthly Installment Date from the dropdown (e.g., 05th of every month).
-
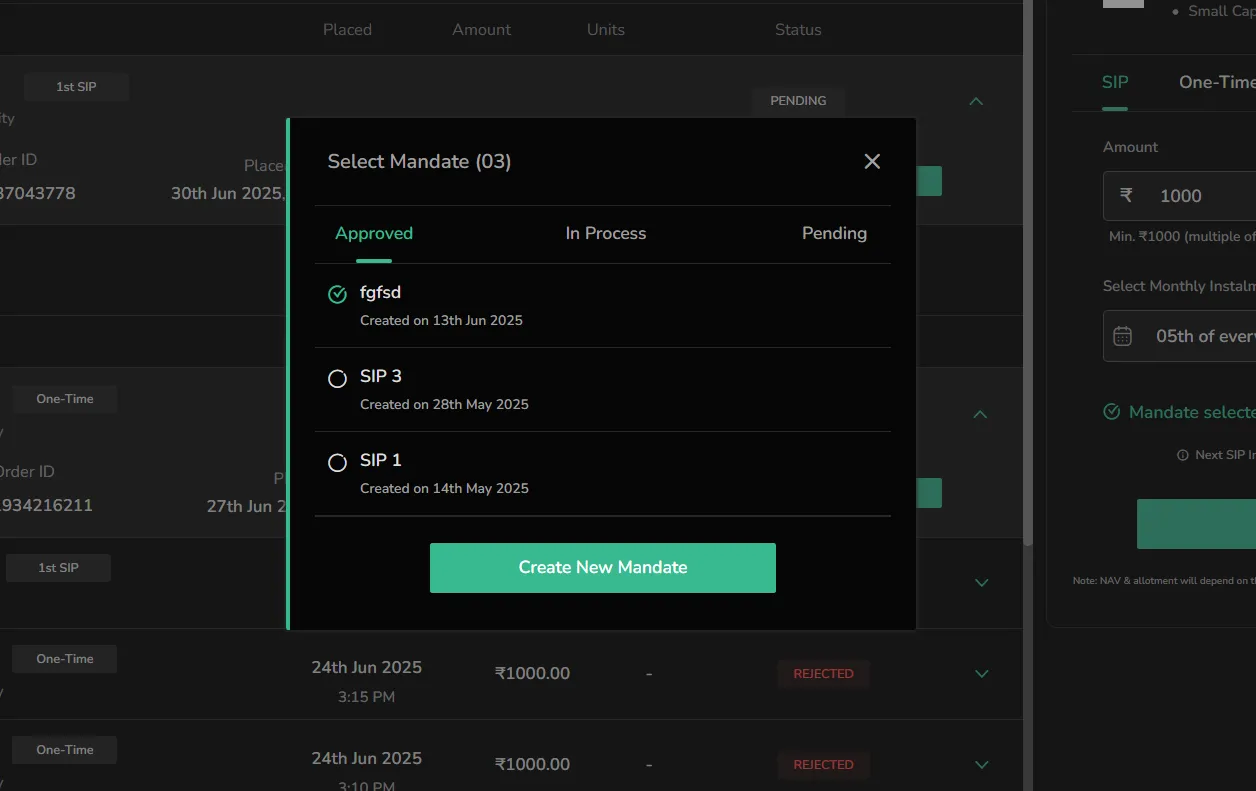
Ensure a Mandate is selected. If not:
-
Click the Mandate button on the top right.
-
A screen will open showing three tabs: Approved, In Process, and Pending.
-
If you don’t have any mandates yet, you’ll see a blank screen with a prompt to create one.
-
Click Create New Mandate to begin.
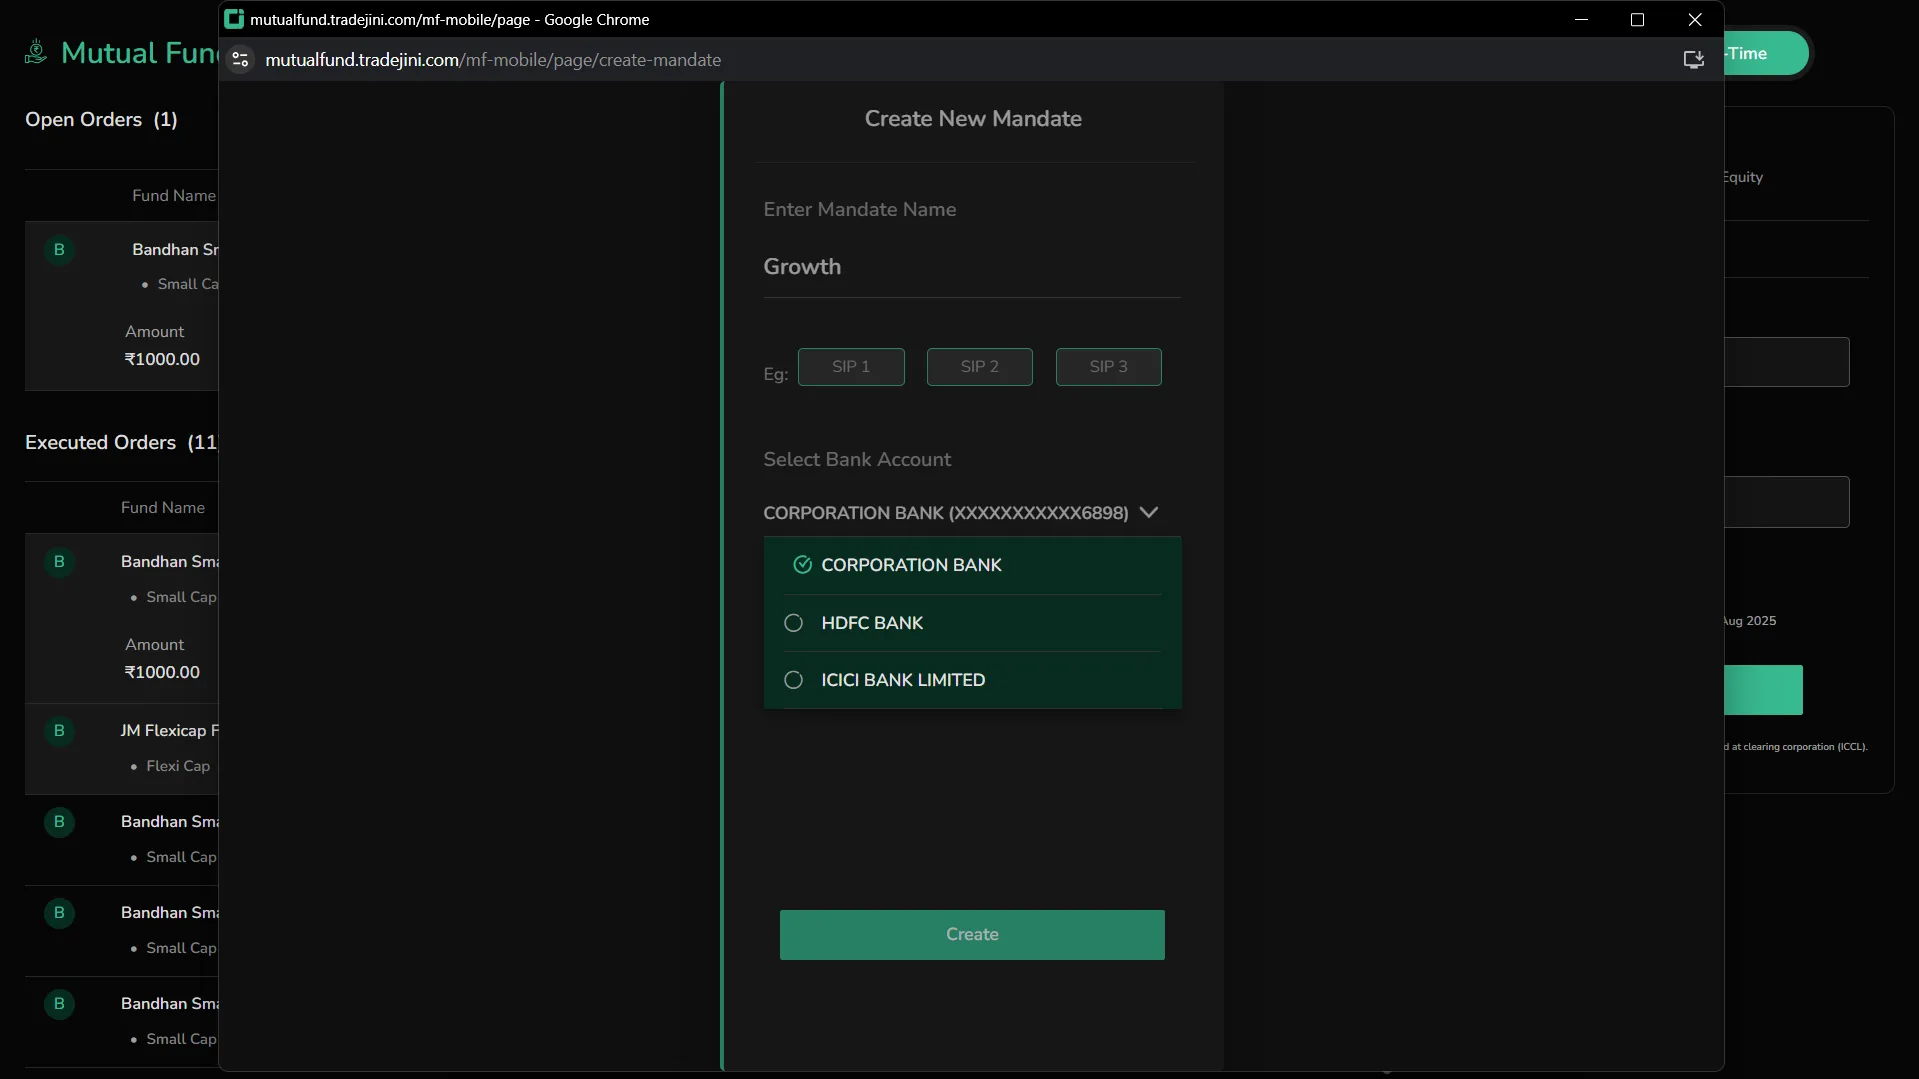
Step 1A: Create New Mandate (If not already done)
If you're placing a SIP order for the first time, you’ll need to set up an auto-debit mandate. Here’s how:
-
Click Create New Mandate on the mandate screen.
-
In the form:
-
Enter a Mandate Name (e.g., "SIP 1").
-
Select your bank account from the dropdown.
-
Click Create.
You will now be redirected to a new screen for authentication. A timer will begin counting down (up to 3 minutes).
Mandate Authentication Flow:
-
Wait to be redirected to the authentication URL.
-
Follow the steps shown:
-
Step 1: Authenticate your email ID.
-
Step 2: Choose a method (Net Banking/Debit Card) to set up autopay.
-
Step 3: Enter your credentials and authorize the mandate.
Once done:
-
Your mandate status will show as In Process or Pending.
-
After approval, it will move to the Approved tab.
-
Return to the SIP order screen and continue after approval of at least one mandate.
You will now see: "Next SIP Installment on [Date]".
Click Start SIP to proceed.
Step 2: Payment Setup
-
Confirm the investment amount.
-
Select your Bank Account from the dropdown.
-
Choose a Payment Mode:
-
UPI – Enter your UPI ID (VPA).
-
Net Banking – Use your bank’s internet banking login.
-
Click Pay.
Step 3: UPI Payment Authorization
-
Confirm the SIP amount.
-
Open your UPI app and approve the request.
-
Do not close the window until confirmation is received.
One-Time Order Placement
Step 1: Fill Order Details
-
Select a mutual fund and switch to the One-Time tab.
-
Enter the investment amount. Minimum is ₹100 and must be in multiples of ₹1 and varies from fund to fund.
-
Note: "Your one-time investment units will be credited within 2 working days."
-
Click Invest.
Step 2: Payment Setup
-
Confirm the amount.
-
Select your Bank Account.
-
Choose a Payment Mode:
-
UPI – Enter your UPI ID.
-
Net Banking – Login via your bank portal.
-
Click Pay.
Step 3: UPI Payment Authorization
-
Confirm the amount.
-
Open your UPI app to complete the transaction.
-
Wait for confirmation before closing the page.
Watchlist
The Watchlist section in CubePlus lets you track mutual fund schemes of interest in one central location. This is ideal for monitoring fund performance before making an investment decision.
How to Use the Watchlist
-
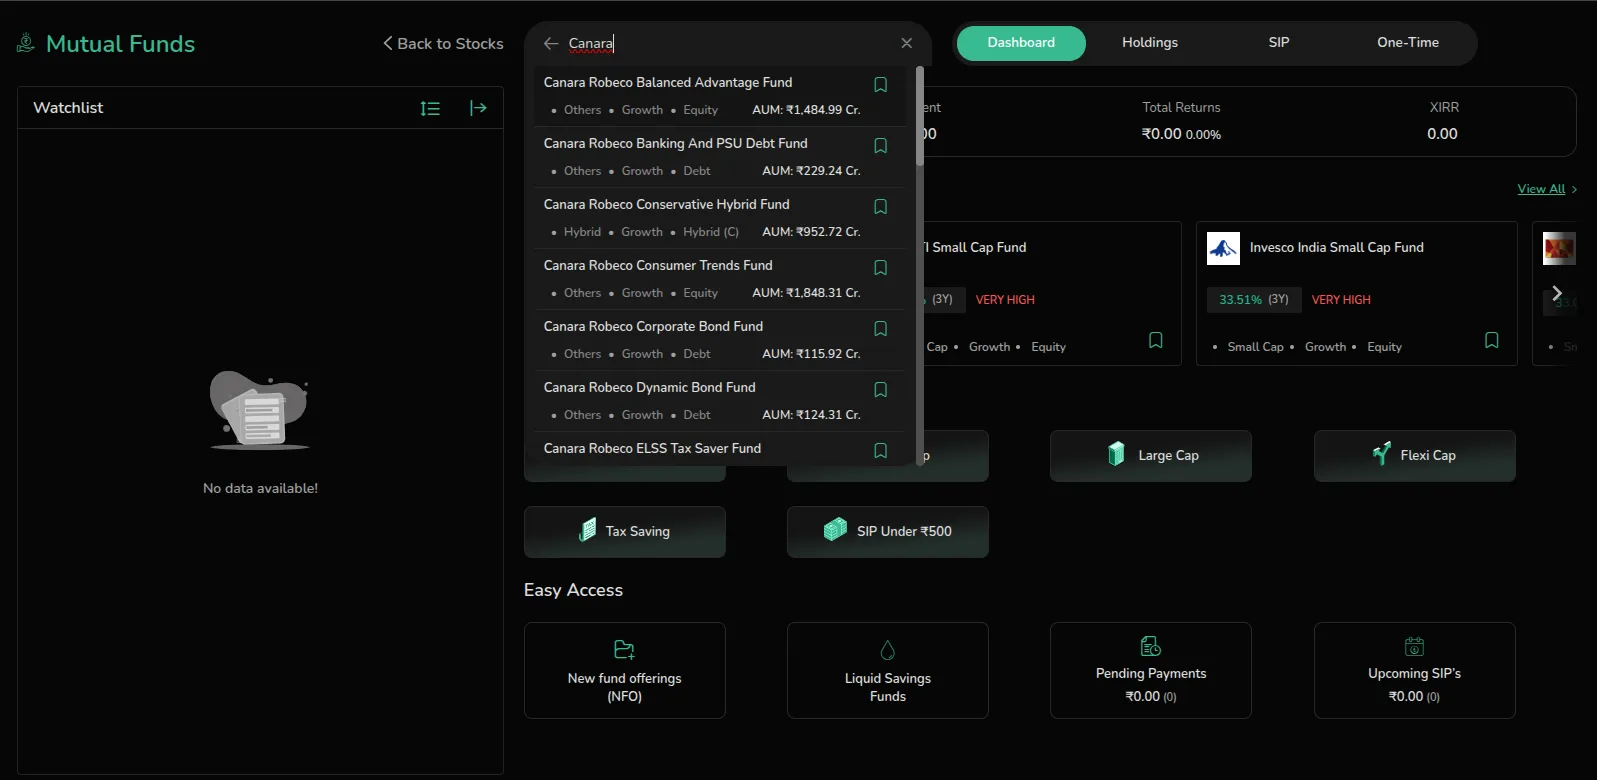
Use the search bar at the top to find and explore mutual funds.
-
Click the bookmark icon on any fund to add it to your Watchlist.
-
All bookmarked funds appear under the Watchlist view for quick access.
Watchlist Features
-
Returns Column – By default, displays daily returns (1D). You can use the dropdown to change the view to 1W, 1M, 3M, 1Y, or 3Y performance.
-
Sort Icon – Tap the sort button to reorder funds:
-
By Name – Sort alphabetically (A–Z)
-
By Return % – Based on return performance in the selected time period ( In expanded watchlist view)
-
Expand View – Click the expand icon (↔) to switch to detailed Watchlist mode with custom column options.
Expanded Watchlist

In expanded mode, you can fully customize what return metrics to track across your Watchlist:
-
CAGR Section – Select return periods like 1D, 1W, 1M, 3M, 6M, 1Y, 3Y, 5Y, or Since Inception
-
Annual Returns – Select specific calendar years (2014 to 2025)
-
SIP Returns – Compare SIP-based returns for holding periods like 1M, 6M, 1Y, 3Y, etc.
-
Maximum 8 columns can be selected and added to your customized watchlist.
-
Click Apply to update your Watchlist table view
-
Click Reset to default to clear your selections
Good to Know
-
Customization helps you compare long-term and short-term performance in one glance.
-
None of these actions trigger a transaction—they’re purely for tracking and comparison.
-
You can remove funds by clicking the bookmark icon again.
Best Performing Funds
This screen highlights the mutual funds that have delivered strong returns over various short-term and long-term periods. It helps you identify top-performing schemes based on return consistency and risk profile.
How to Access
-
Navigate to Dashboard > Best Performing Mutual Funds.
-
The page is divided into Short-Term and Long-Term tabs.
Fund Data Displayed
Each row displays detailed performance metrics to help you evaluate each fund thoroughly:
-
Fund Name and Category Tags (Growth, Equity, Small Cap, etc.)
-
Risk Rating – Indicates volatility (e.g., VERY HIGH)
-
AUM – Assets Under Management, shown in ₹ Cr.
-
Returns (CAGR) – Compounded Annual Growth Rate for multiple durations:
- 1M, 3M, 6M, 1Y, 3Y, 5Y, and Since Inception
-
The list can be expanded to show these columns for side-by-side comparison
-
Use scroll and filters to view a broader set of high performers
- 1Y, 3Y, 5Y, and Since Inception for Long-Term tab
Customize Your View
You can tailor the data displayed by clicking the Customize Columns icon on the top right. This opens a selector where you can choose up to 8 data points across the following sections:
-
CAGR Durations – Choose return periods like 1D, 1W, 1M, 3M, 6M, 1Y, 3Y, 5Y, Since Inception
-
Annual Returns – Select year-wise returns from 2014 to 2025
-
SIP Returns – Compare how the fund has performed through SIPs across 1W to 4Y durations
-
Risk – Toggle visibility of the risk rating
-
NAV and Fees – Add information like NAV values and associated expense ratios
After selecting your preferred metrics, click Apply to update the table. This makes it easy to focus on metrics that matter most to you.
Actions You Can Take
-
Click the Bookmark icon to add the fund to your Watchlist.
-
Use this screen as a quick filter to begin your investment in funds with proven track records.
-
Evaluate both return potential and risk profile before proceeding.
This tool helps you shortlist top performers without having to analyze each fund manually—ideal for users looking to act on historical strength.
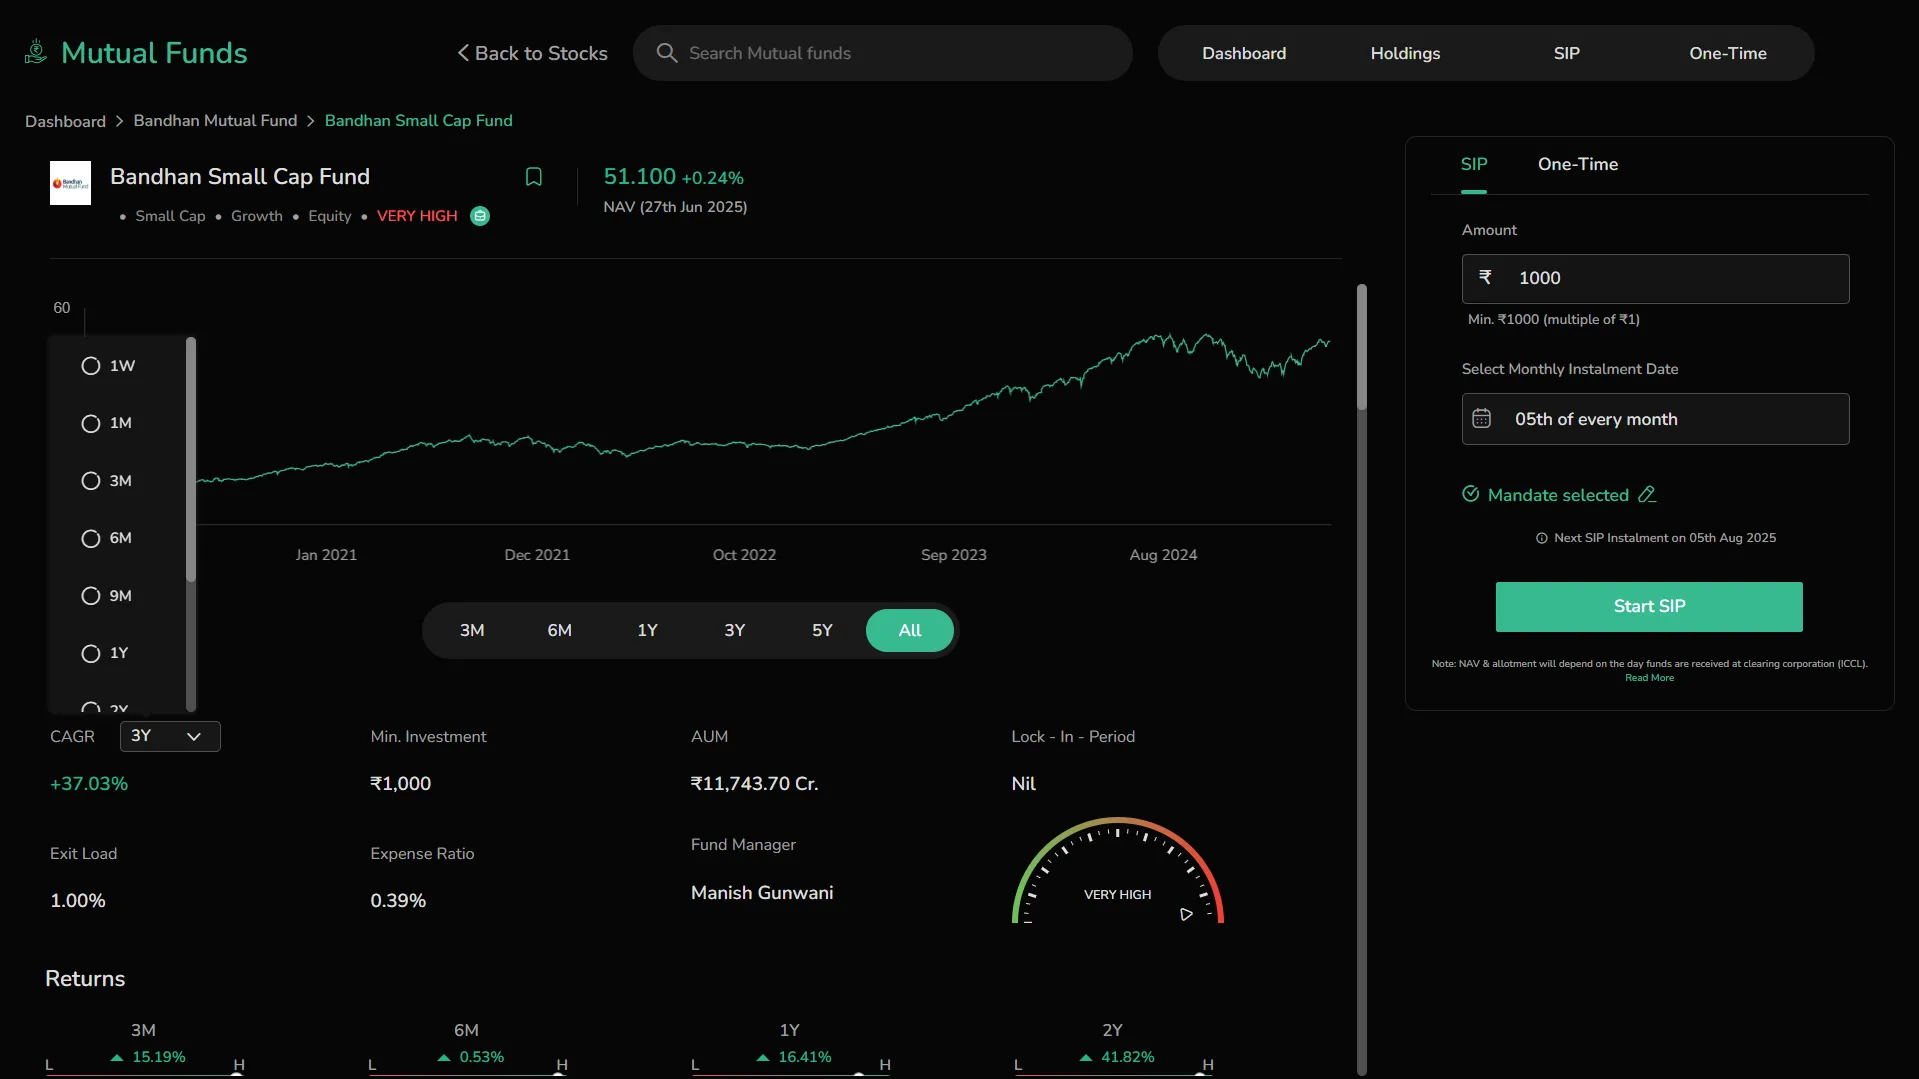
Fund Overview
The Fund Overview page provides in-depth information about a selected mutual fund, including its historical NAV trend, returns, risk profile, holdings, sector allocation, and fund house credentials. This page is designed to help you make a well-informed investment decision.
Fund Header
-
Displays the Fund Name, NAV (latest), Fund Type (Growth, Equity, Small Cap), and Risk Level (e.g., Very High).
-
Bookmark icon allows you to add the fund to your Watchlist.
NAV Chart and Time Selector
-
View historical NAV movement plotted over time.
-
Use the time range selector (3M, 6M, 1Y, 3Y, 5Y, ALL) to adjust the graph’s timeline.
Fund Metrics

Below the chart, a quick snapshot of the fund's performance and fundamentals is shown:
-
CAGR – Use the dropdown to view the fund’s Compounded Annual Growth Rate over different timeframes like 1Y, 3Y, or 5Y. This metric shows the average yearly return, helping you assess long-term performance (e.g., 3Y CAGR of +35.62%).
-
Minimum Investment – Indicates the least amount you must invest to get started with this fund. For one-time orders, this is usually ₹5,000 or as specified by the AMC.
-
AUM – Refers to the total market value of assets managed by the fund. A higher AUM may reflect investor confidence and fund stability (e.g., ₹2,504.40 Cr).
-
Lock-in Period – This tells you whether you can withdraw your investment anytime or need to wait a fixed duration. If it says "Nil", there’s no restriction on redemption.
-
Exit Load – A fee charged if you exit the fund before a defined period (often 1 year). Helps discourage short-term exits. Shown as a percentage of the withdrawn amount.
-
Expense Ratio – The annual operating cost of managing the fund, charged as a percentage of AUM. A lower ratio means more of your investment goes toward generating returns.
-
Fund Manager – Displays the name of the professional managing the fund’s portfolio. Knowing their experience and past track record helps evaluate management quality.
-
Risk Meter – A visual gauge indicating the fund’s volatility. Labels like "Very High" suggest larger fluctuations in returns and higher potential risk/reward.
Returns Comparison
 A separate section visually compares fund returns across multiple durations:
-
Compare fund’s returns vs. the high and low range during each period
-
Useful for understanding where the current NAV stands relative to historical performance
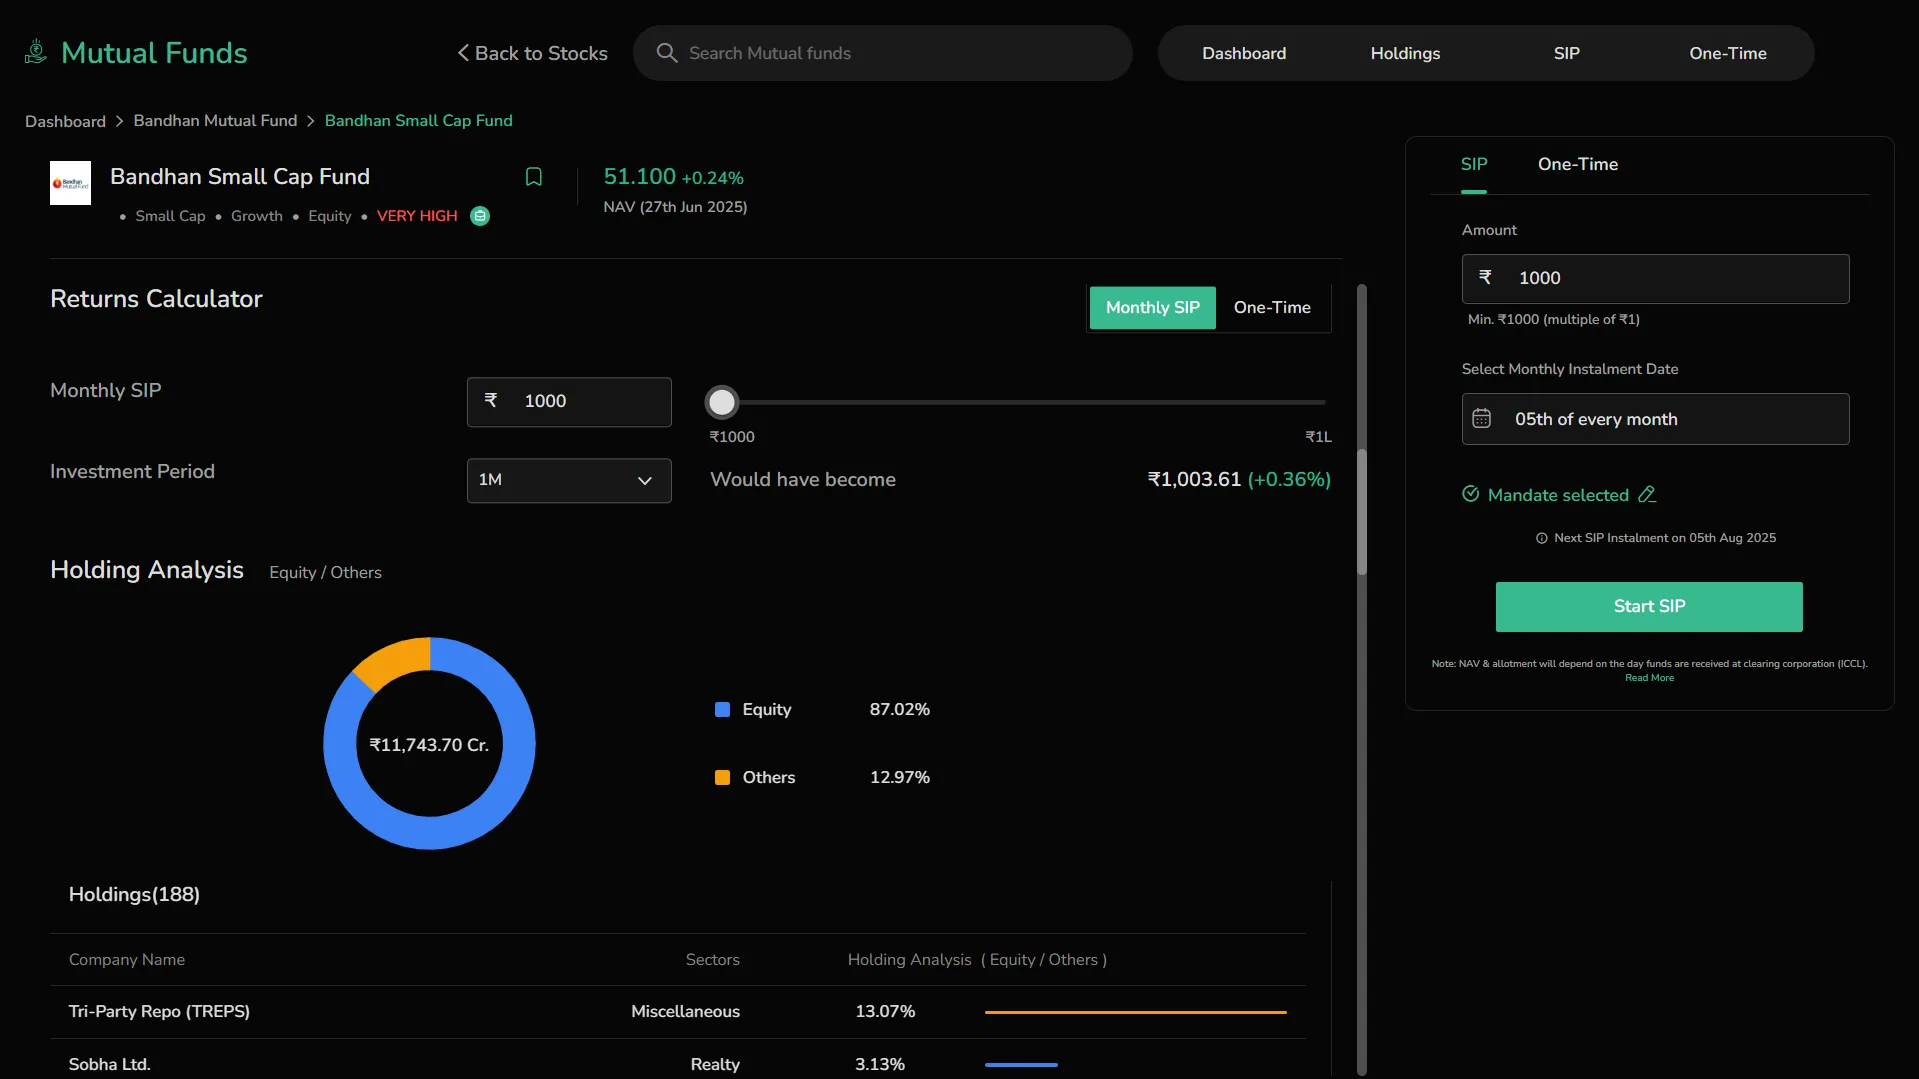
Holding Analysis
Breakdown of where the fund has invested:
-
Visual representation of fund distribution across Equity, Debt, and Other categories.
-
Equity is shown in blue, Debt in orange, and Others in green.
-
The total invested value is displayed at the center of the chart (e.g., ₹1,056.15 Cr).
-
Percentage allocation per category (e.g., Equity 50%, Debt 30%, Others 20%) helps understand the fund’s portfolio mix.
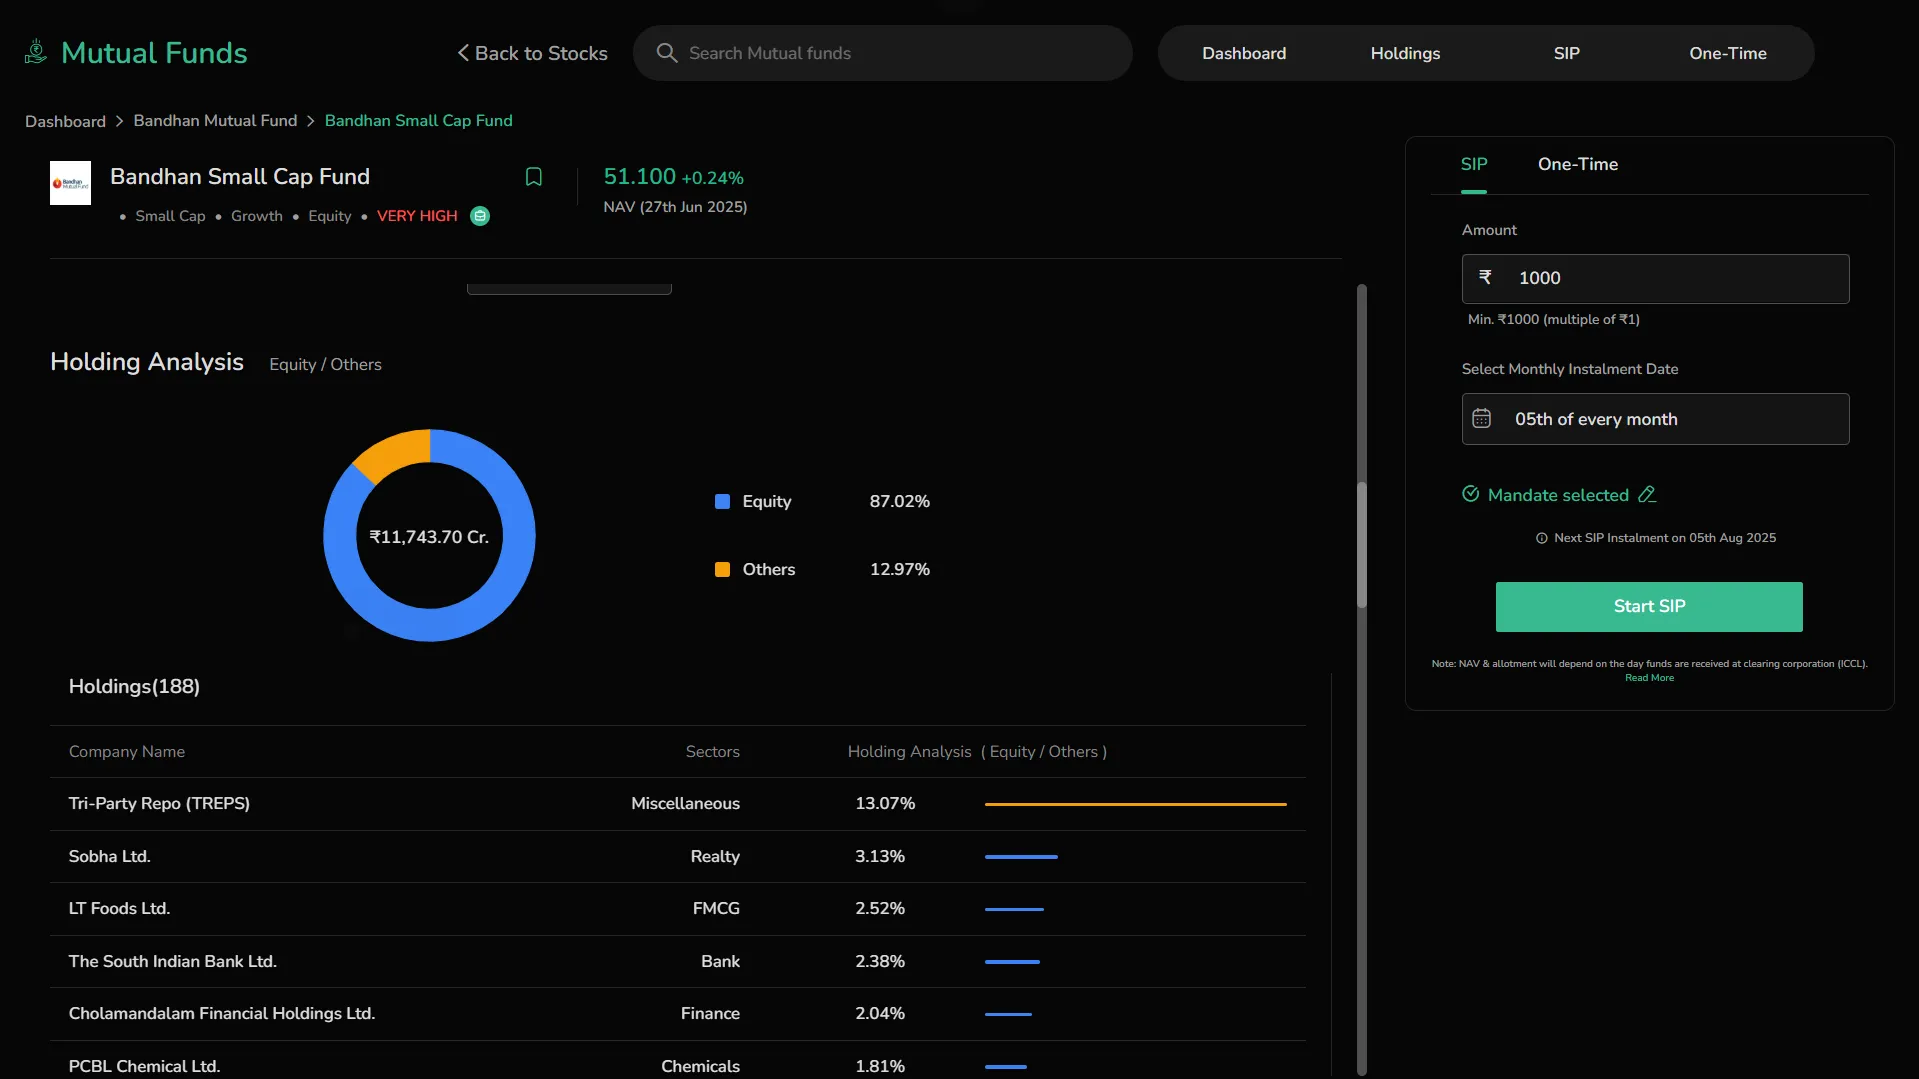
-
Holdings List – Below the chart, view all individual holdings:
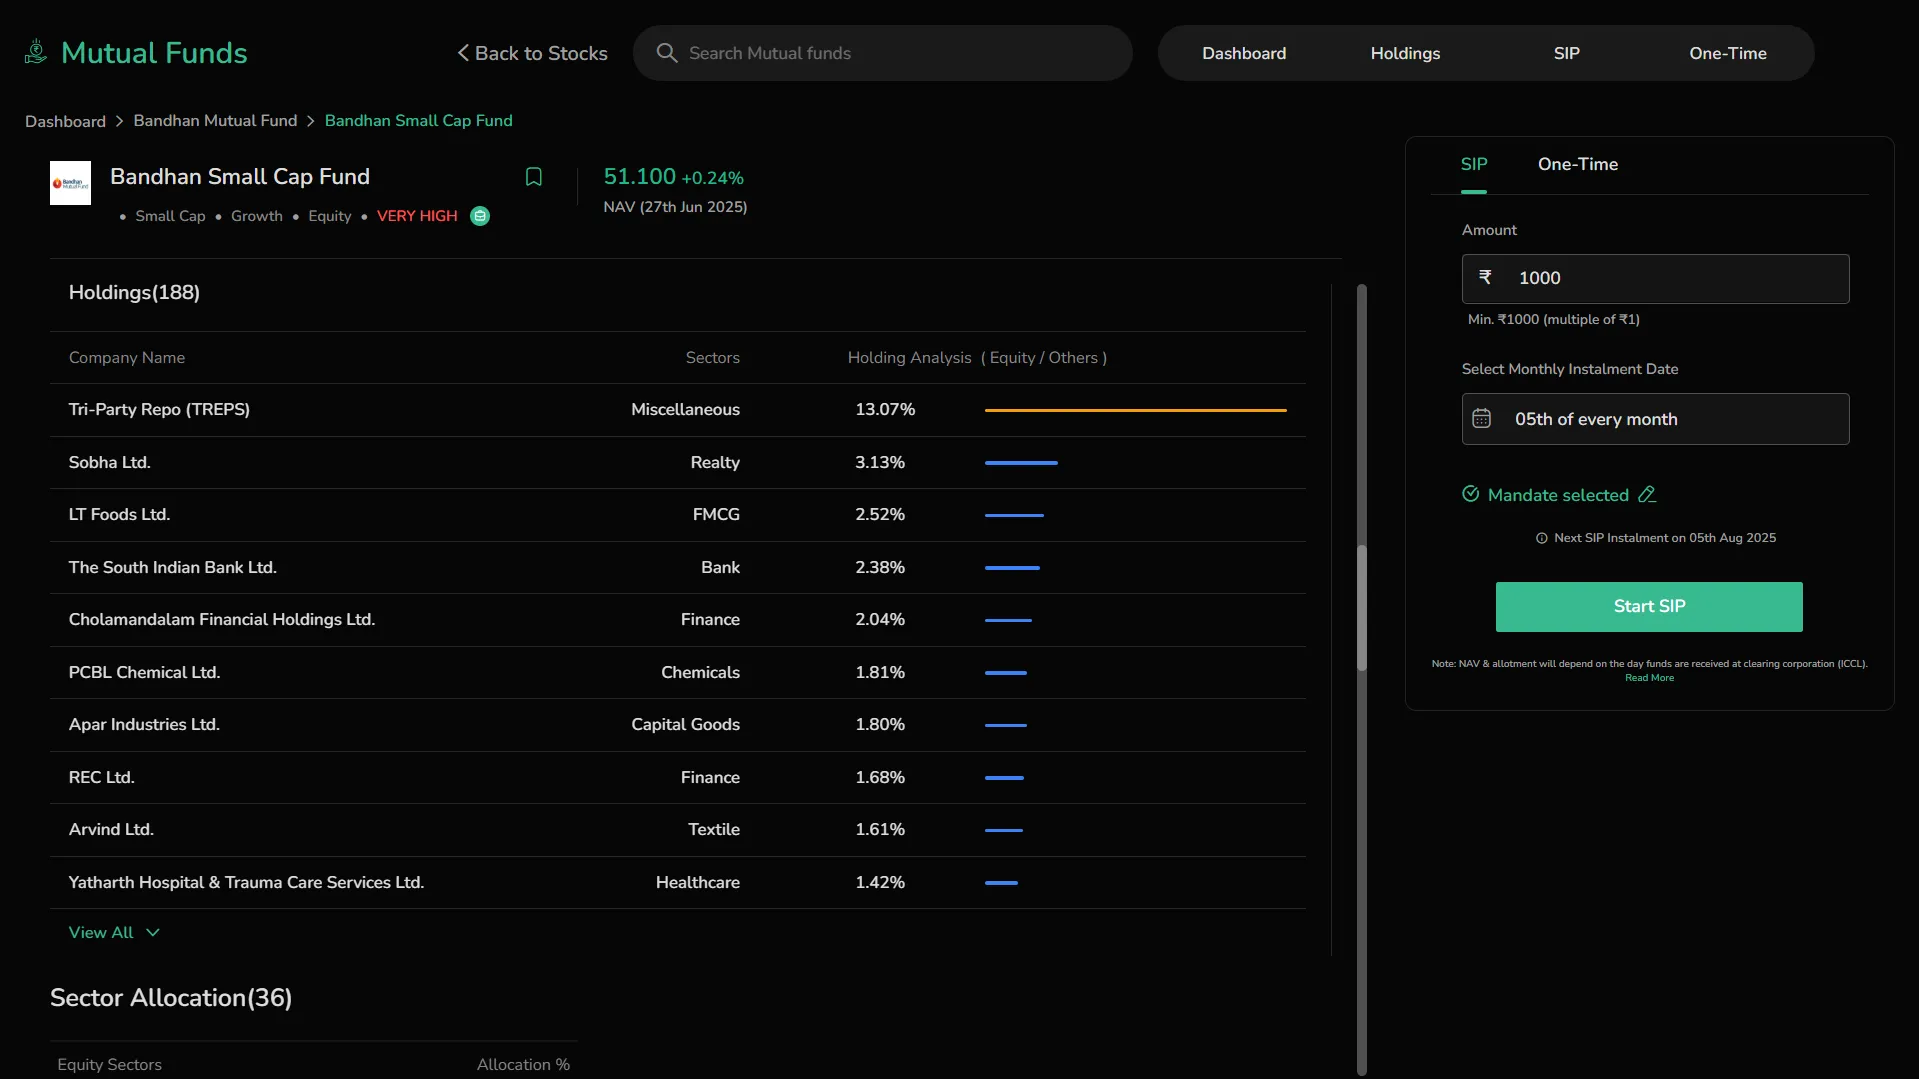
-
Company Name – Each business the fund has invested in.
-
Sector – The industry classification of the company.
-
Weightage % – Indicates how much of the total portfolio is allocated to that specific holding.
-
Holding Analysis Bar – Color-coded progress bar that visually represents the allocation:
-
Equity = Blue
-
Debt = Orange
-
Others = Green
-
This section helps you assess diversification and exposure across asset classes and specific companies.
Sector Allocation
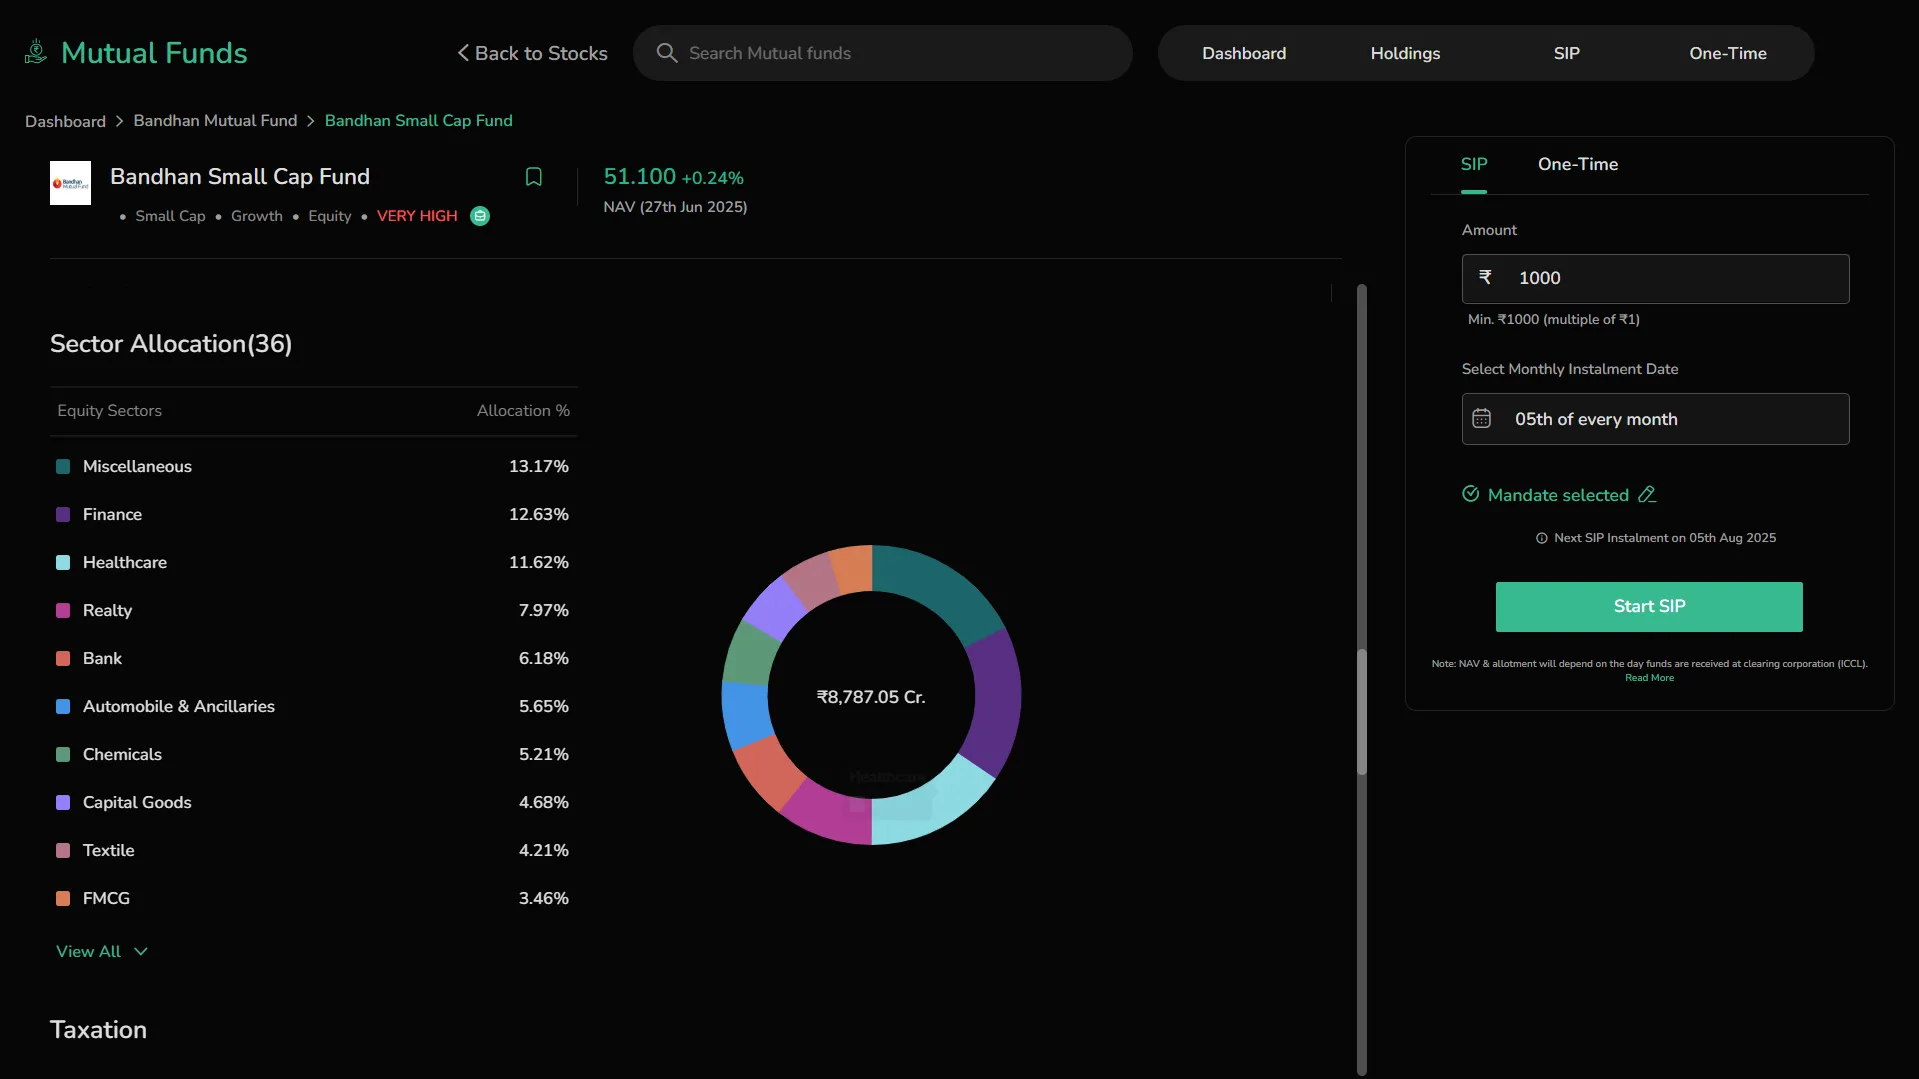
- A circular donut chart visually breaks down the fund’s exposure to various equity sectors. Each color-coded segment represents a sector such as Finance, IT, or Healthcare, with the size of the segment proportional to the investment percentage. This allows you to quickly grasp which sectors the fund is more concentrated in.
Below the chart, a table presents detailed numerical data, listing all equity sectors along with their exact allocation percentages. This makes it easier to compare sector-wise exposure and understand the fund’s strategic focus. You can also click View All to expand the list and reveal additional sectors not immediately visible in the default view.
- Click View All to see the complete list
Taxation
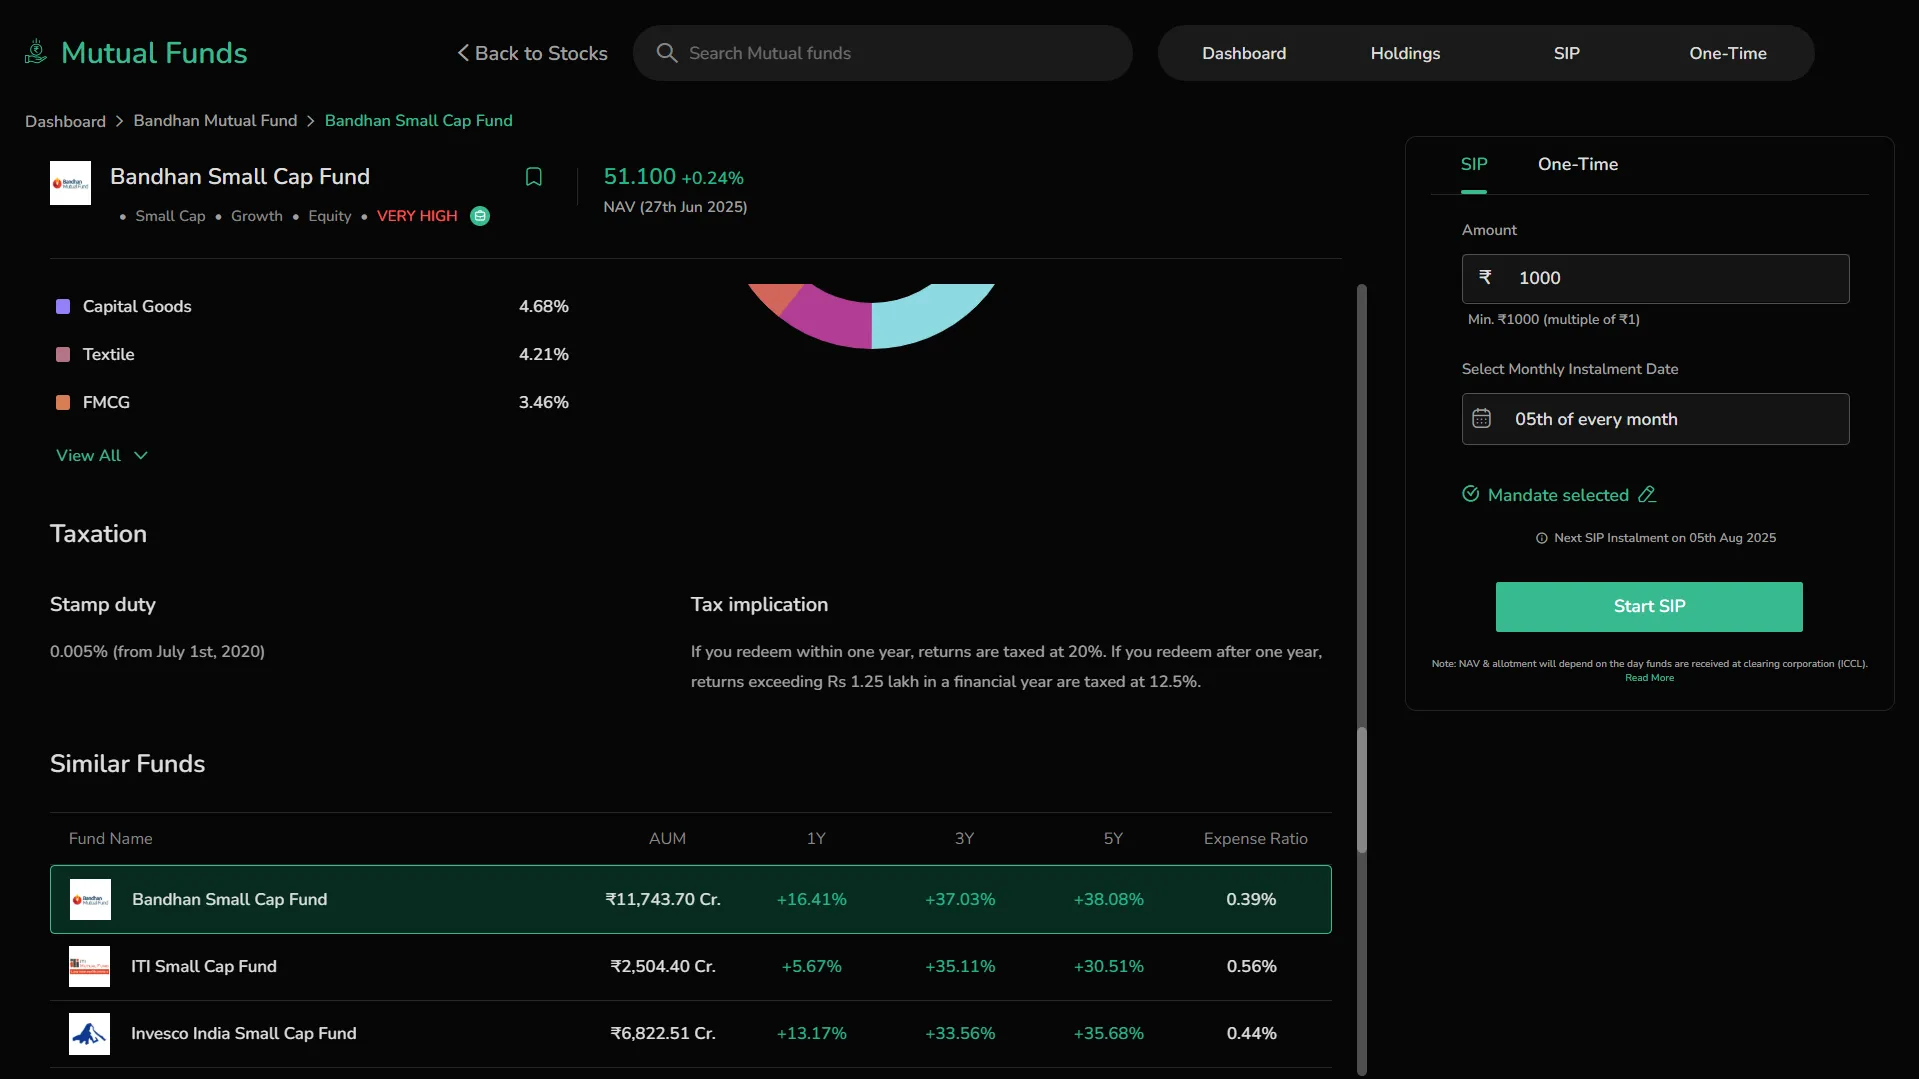
- Stamp Duty – Displayed with effective rate and date (e.g., 0.005% from July 1st, 2020)
Tax Implication
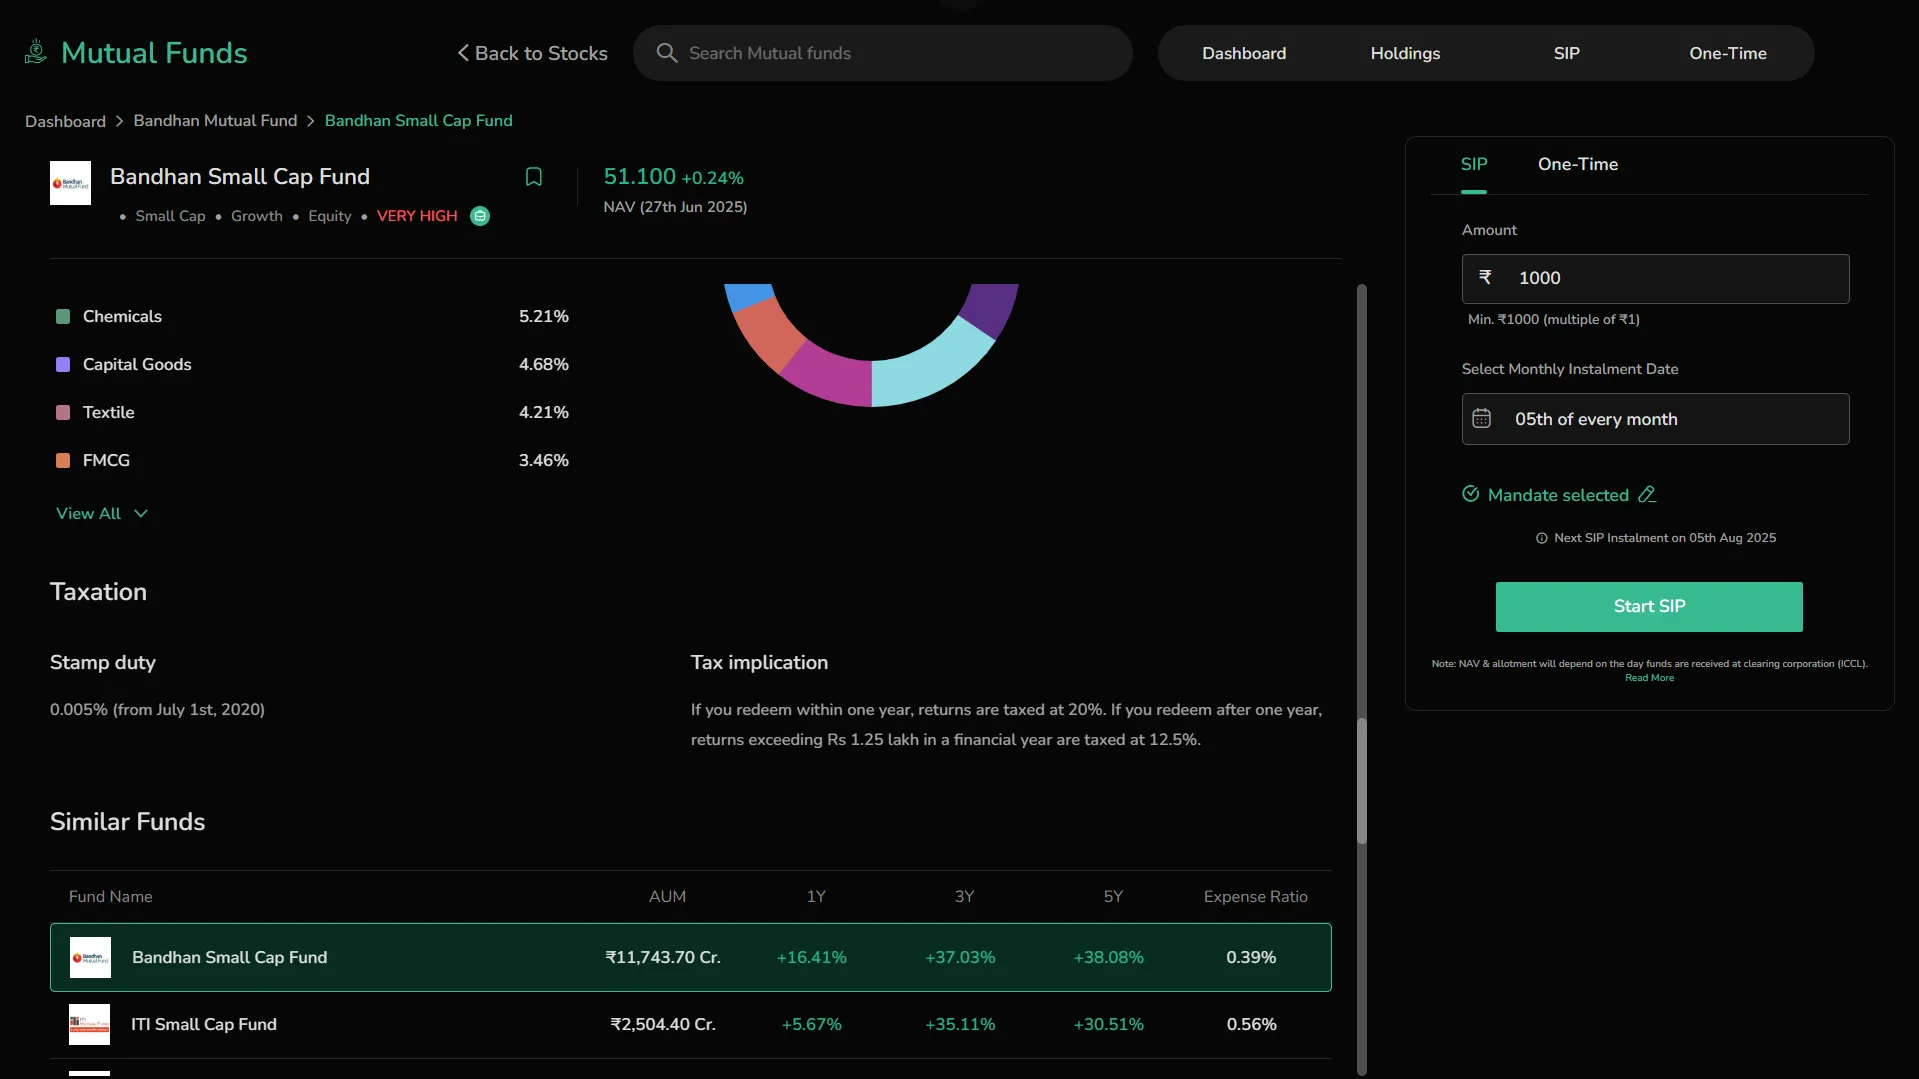
-
Summary of short-term and long-term capital gains rules
-
e.g., Under 1 year: 20% tax
-
After 1 year: 12.5% tax on gains above ₹1.25 lakh/year
Similar Funds
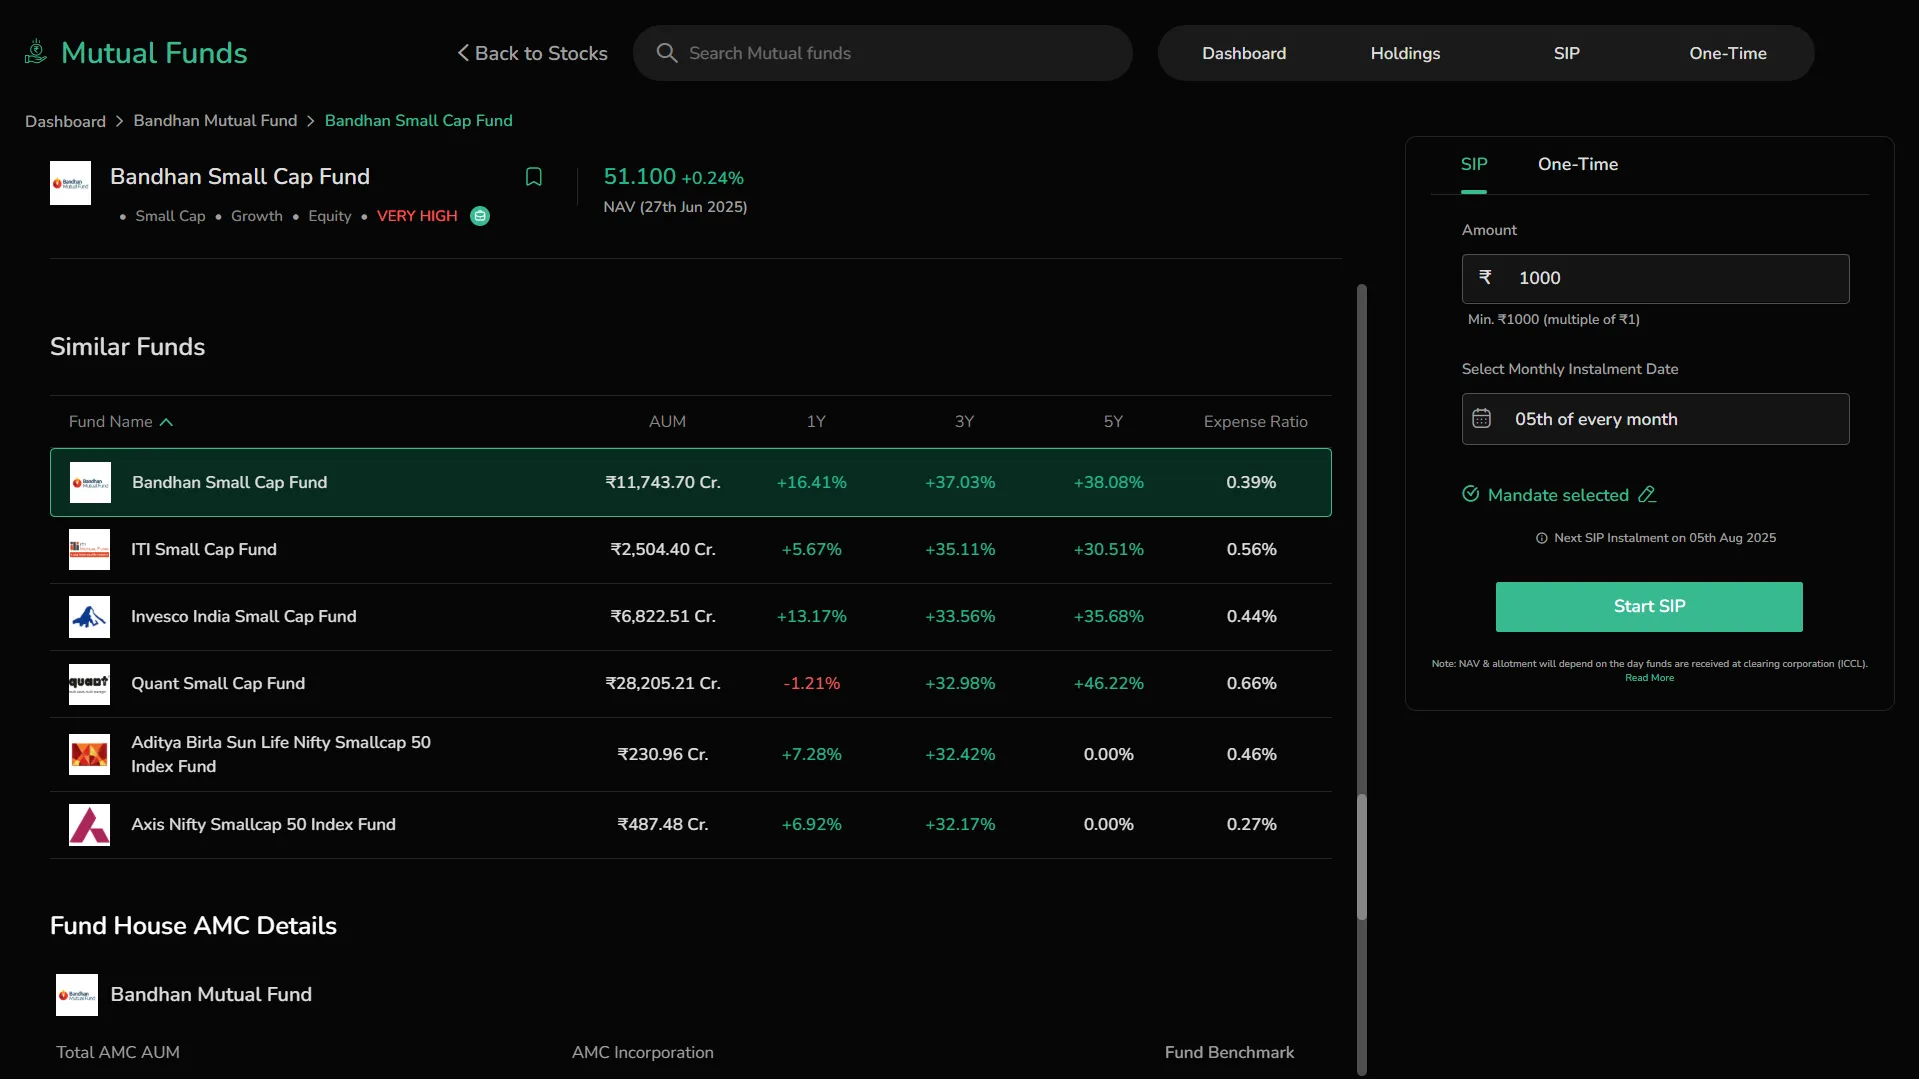
A comparison table of similar mutual funds:
-
Shows: Fund Name, AUM, 1Y, 3Y, 5Y Returns, and Expense Ratio
-
Use it to benchmark performance against peer funds before investing
Fund House & Investment Objective
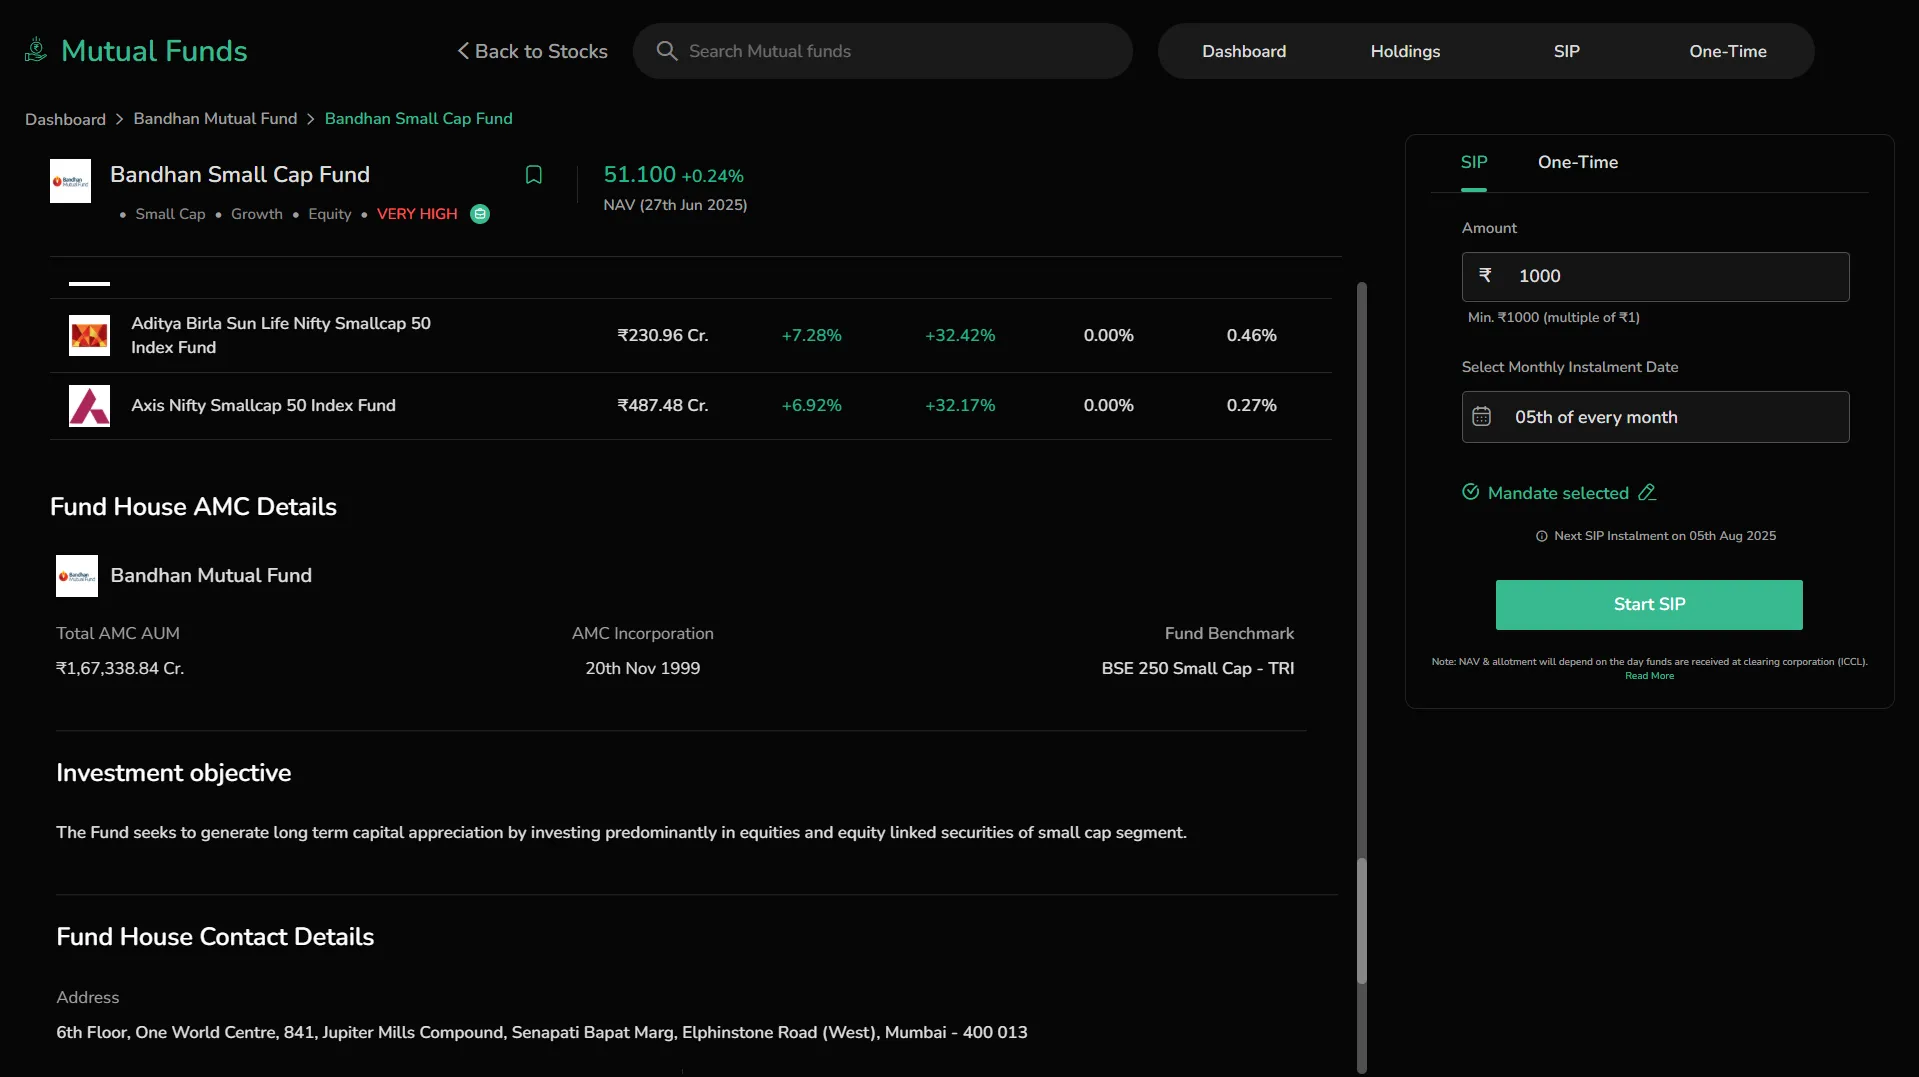
-
Shows the fund house logo, total AUM, launch date, and the benchmark index the fund follows (e.g., Nifty Smallcap 250 - TRI).
-
Also gives a brief note on the fund’s investment objective — usually the fund’s goal, like growing wealth through small-cap equity investments.
Fund House Contact Details
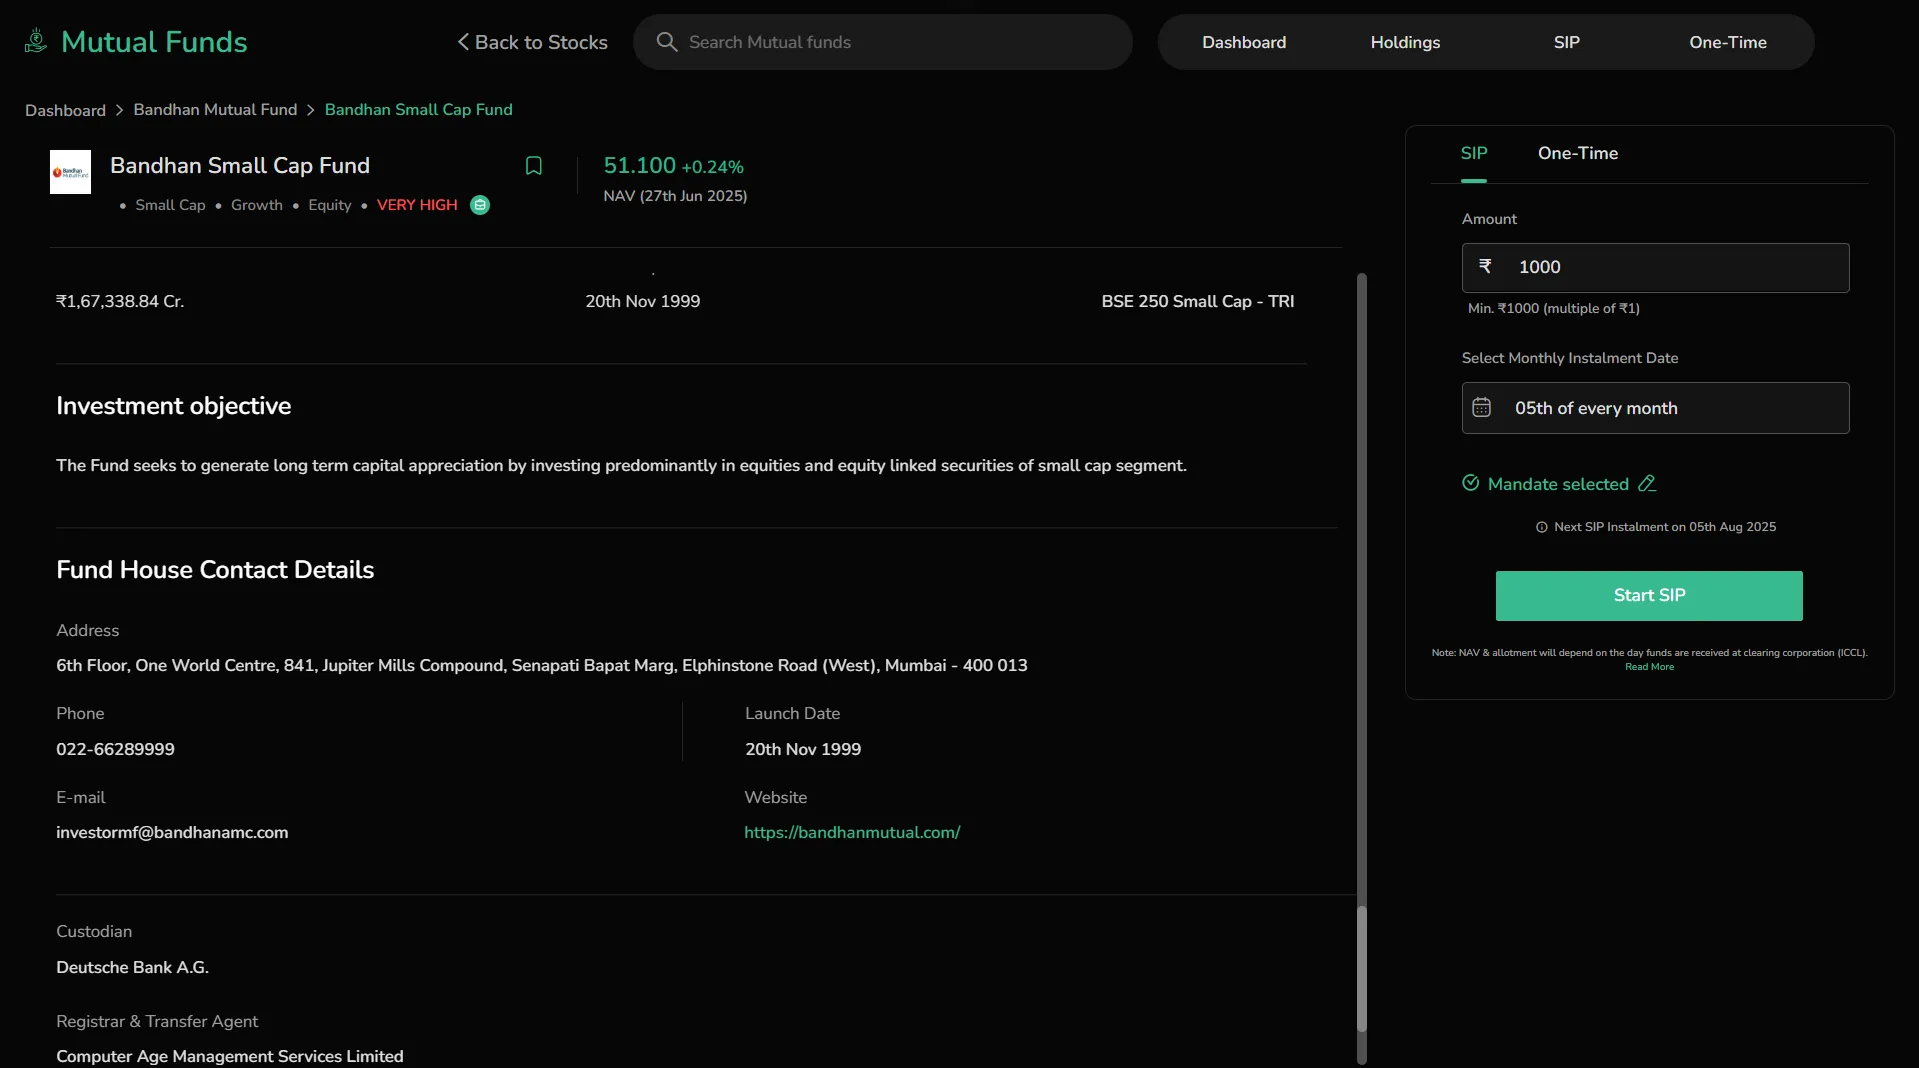
-
Provides basic contact info like the address, phone number, email, and website.
-
Mentions the custodian (who safeguards fund assets) and the RTA (handles investor services).
-
Helpful if you want to get in touch or check the credibility of the fund house.