Dashboard
The CubePlus Dashboard brings market information, portfolio details and trading tools together on a single screen. On the Web, the Dashboard is organised into Stocks and Derivatives tabs.
Stocks
On the Web
Access Dashboard
- Log in to CubePlus Web.
- Click Dashboard from the main menu.
- Select the Stocks tab.
The Stocks tab brings together portfolio tracking, stock analytics, market movers, ETFs, results and other equity-market tools.
Index Ticker
The index ticker at the top of the Dashboard displays selected indices and their market movement. You can choose which indices appear, change their order, and pause the ticker when required.

Manage Indices
- Click the Settings icon next to the index ticker.
- Select or clear the checkbox next to an index to add or remove it from the ticker.
- Use the drag handle to change the order of the indices.
- Click Reset to restore the default selection.
!!! note At least eight indices must remain selected.
Quick Actions
Hover over an index in the ticker to display quick actions such as Chart, Option Chain, Strategy Builder, Alerts and Pin. Select an action to open the corresponding feature for that index.
Advance/Decline
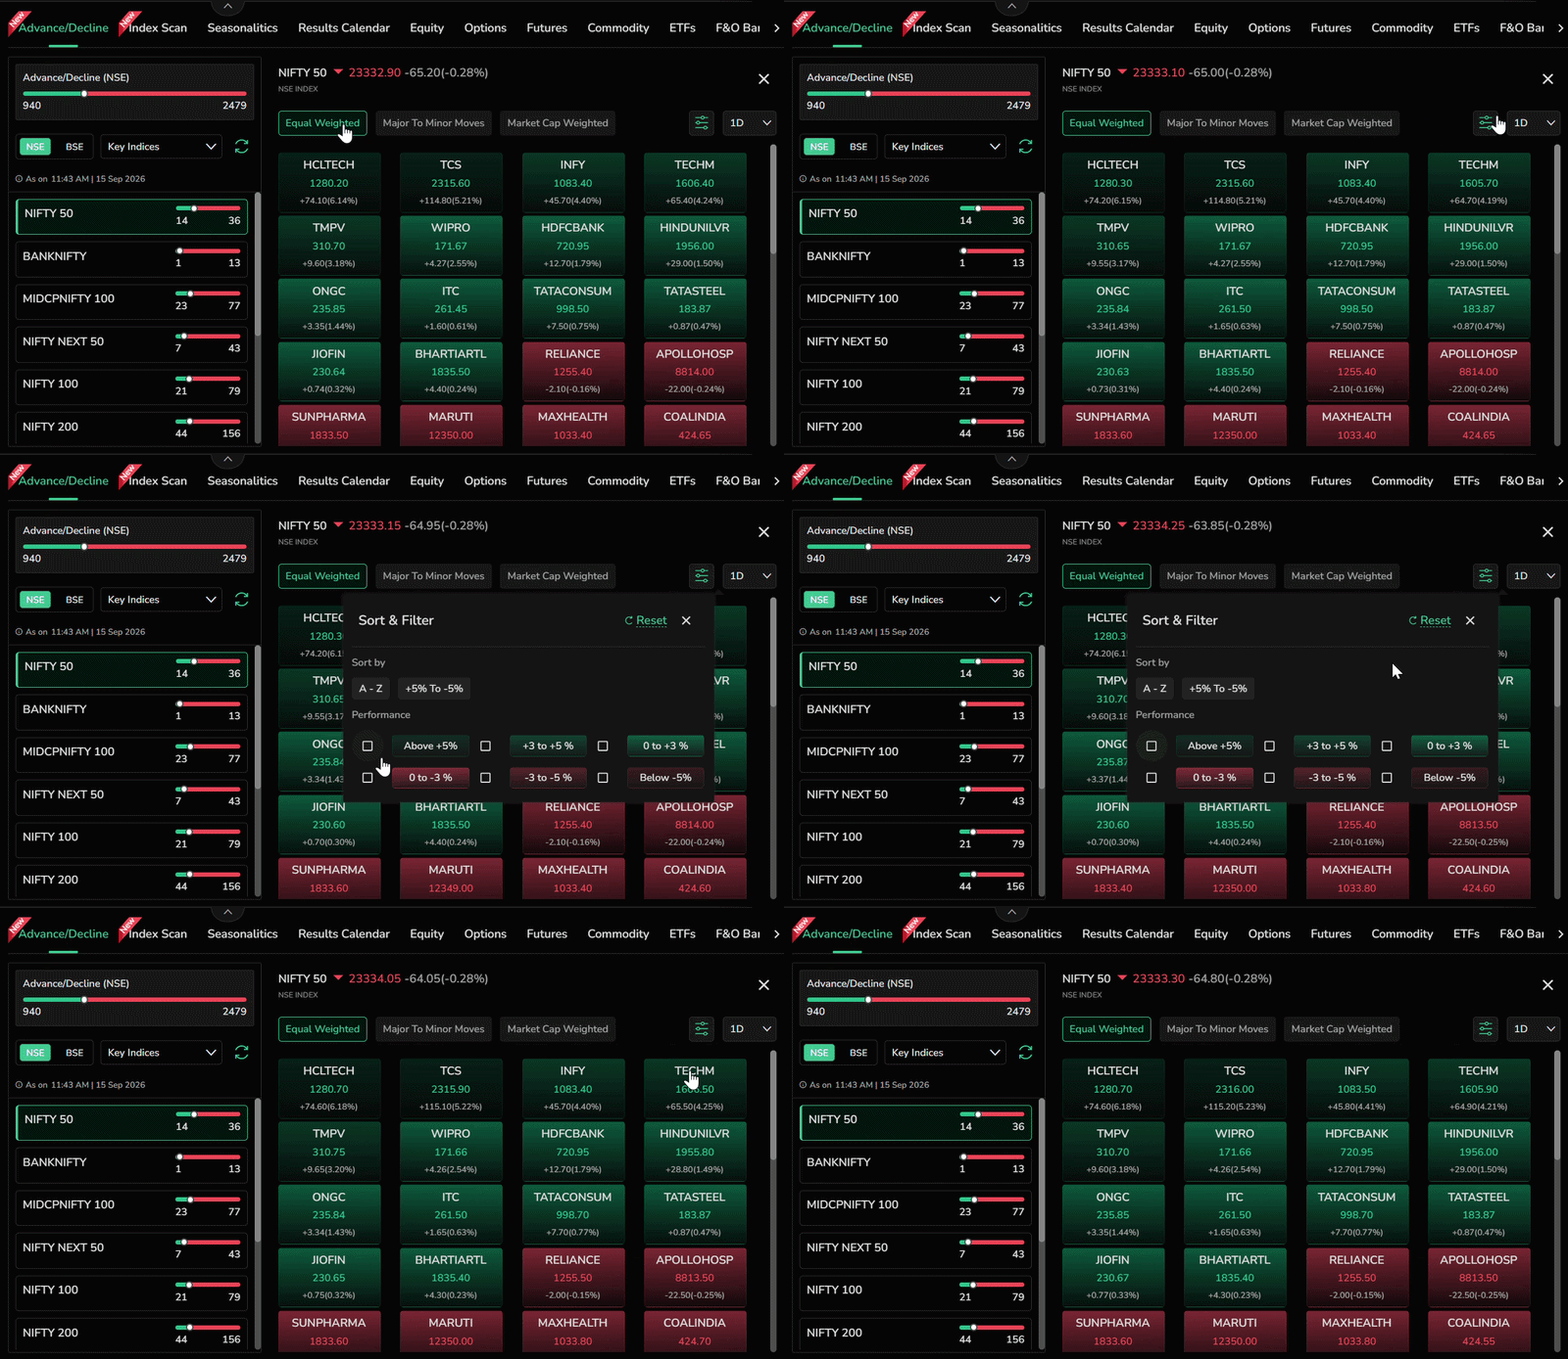
Advance/Decline shows the number of stocks that are advancing and declining within an index. It helps you assess whether an index move is broad-based or concentrated in a smaller number of stocks.
View Advance/Decline
- In the Advance/Decline widget, select NSE or BSE.
- Select an index or market segment as required.
- Click View All to open the detailed Advance/Decline view.
The detailed view shows the selected index and its constituents. Each stock displays its LTP and percentage change.
Sort the Constituents
- Equal Weighted – treats each constituent equally.
- Major to Minor Moves – sorts constituents by their percentage movement.
- Market Cap Weighted – gives greater weight to larger constituents.
Sort and Filter
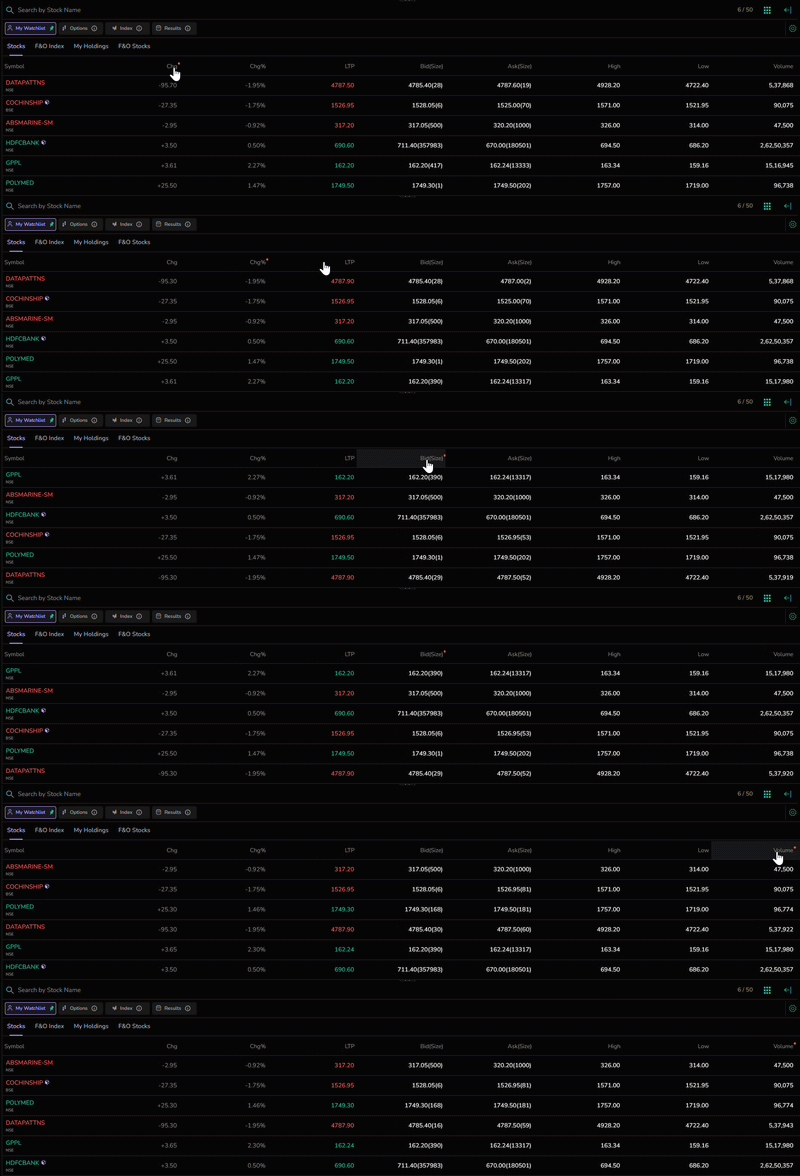
Use Sort & Filter to sort stocks A–Z or by percentage move and filter them into performance bands such as above +5%, +3% to +5%, 0% to +3%, 0% to -3%, -3% to -5%, and below -5%.
Timeframes
Advance/Decline can be viewed across different timeframes, including 1 day, 1 week, 1 month, 6 months, 1 year and 5 years. This allows you to compare market breadth over both short- and long-term periods.
Market Movers
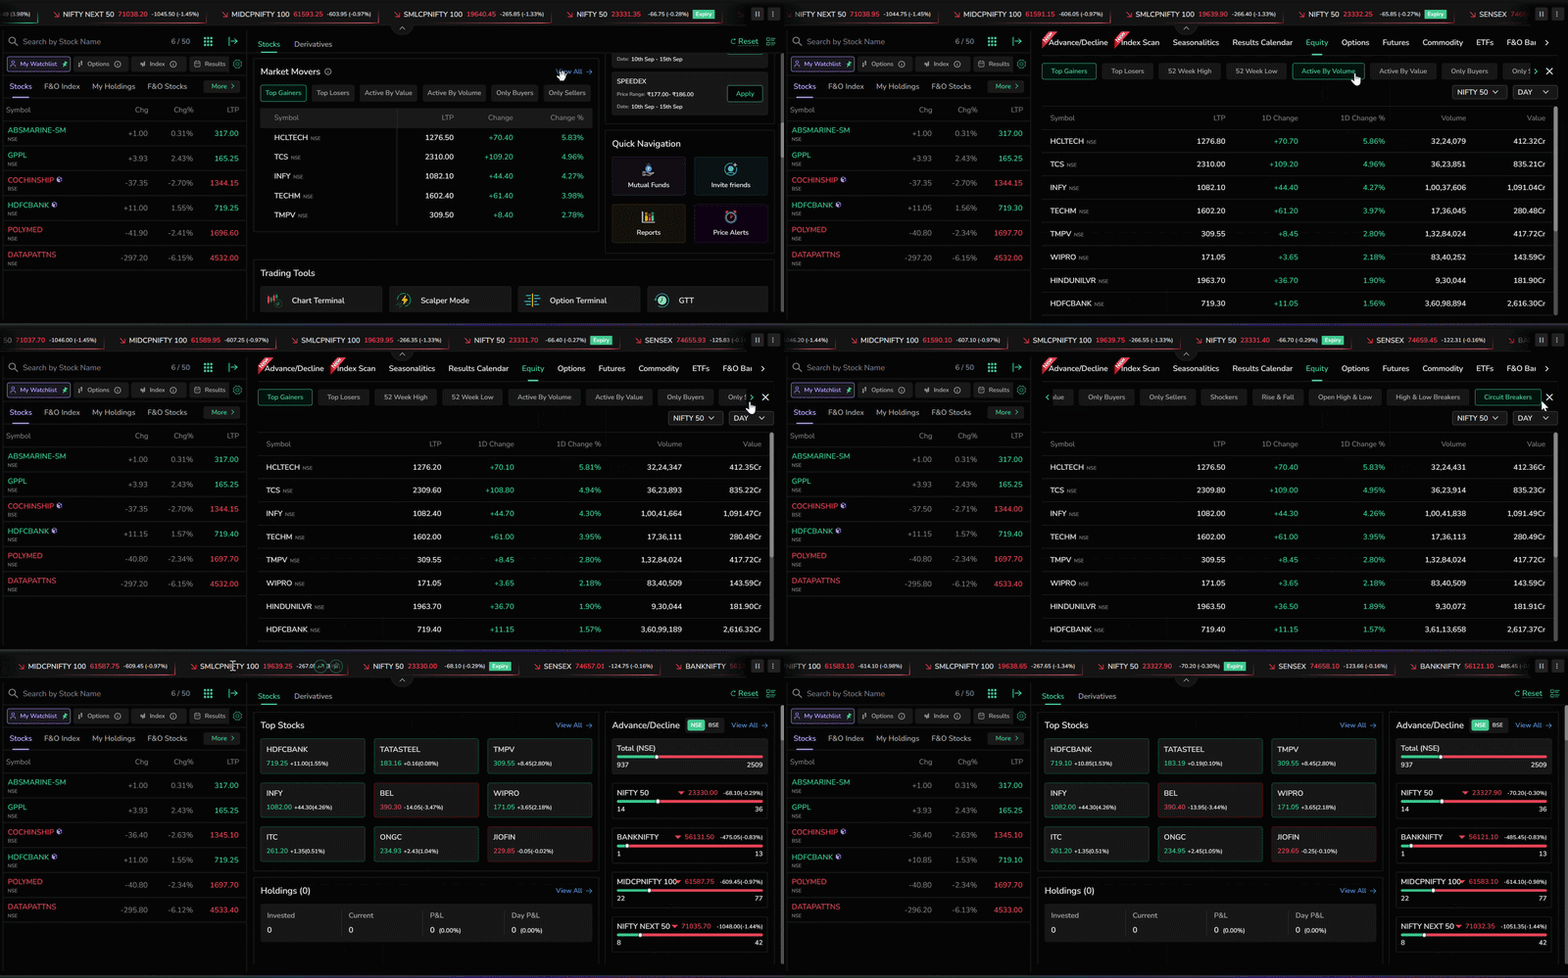
Market Movers helps identify stocks showing significant price or trading activity. The Stocks Dashboard provides quick access to the major mover categories.
| Category | Use |
|---|---|
| Top Gainers / Top Losers | View stocks leading or lagging the market. |
| 52 Week High / 52 Week Low | Identify stocks trading at their highest or lowest levels over the past year. |
| Active By Volume | Identify stocks with high share-volume activity. |
| Active By Value | Identify stocks with high rupee turnover. |
| Only Buyers / Only Sellers | Identify stocks with one-sided buying or selling activity. |
| Shockers | Identify unusual price or volume movements. |
| Rise & Fall | Filter stocks by volume-up/price-up or volume-up/price-down behaviour. |
| Open High & Low | Identify stocks that opened at their day's high or low. |
| High & Low Breakers | Track stocks breaking recent highs or lows. |
| Circuit Breakers | Identify stocks that have hit an upper or lower circuit. |
Click View All to open the detailed Movers view and apply the available index and mover filters.
Positions and Funds
Positions
The Positions section provides a quick view of your open positions. You can expand the Positions view to see all positions, sort them by MTM or P&L, and save your preferred layout.
Funds
The Funds section displays available and utilised funds. The Dashboard provides access to both equity and commodity fund information.
Index Scan
Index Scan provides market information for major indices through four views: Overview, Technicals, Performance and Pivot.
| View | Information |
|---|---|
| Overview | LTP, change, day range and 52-week range. |
| Technicals | Technical indicators including SMA, EMA, CCI, ROC(20) and Hull Moving Average. The indicators can be customised. |
| Performance | Returns across periods from 1 week to 5 years. |
| Pivot | Standard, Fibonacci and Camarilla pivot levels with support and resistance levels. |
Seasonalitics
Seasonalitics shows the average historical performance of a stock or index for a selected month, using data going back to 2014.
- Historical – view seasonal performance year by year.
- Current – compare the current price with the seasonal average.
- Heatmap – view seasonal performance across constituents in a colour-coded grid.
Results
The Results widget helps you track upcoming and recent corporate earnings.
- Select Yesterday, Today, Tomorrow, This Week or Next Week.
- Use the date picker to select a specific date.
- Filter the list to F&O stocks when required.
IPO
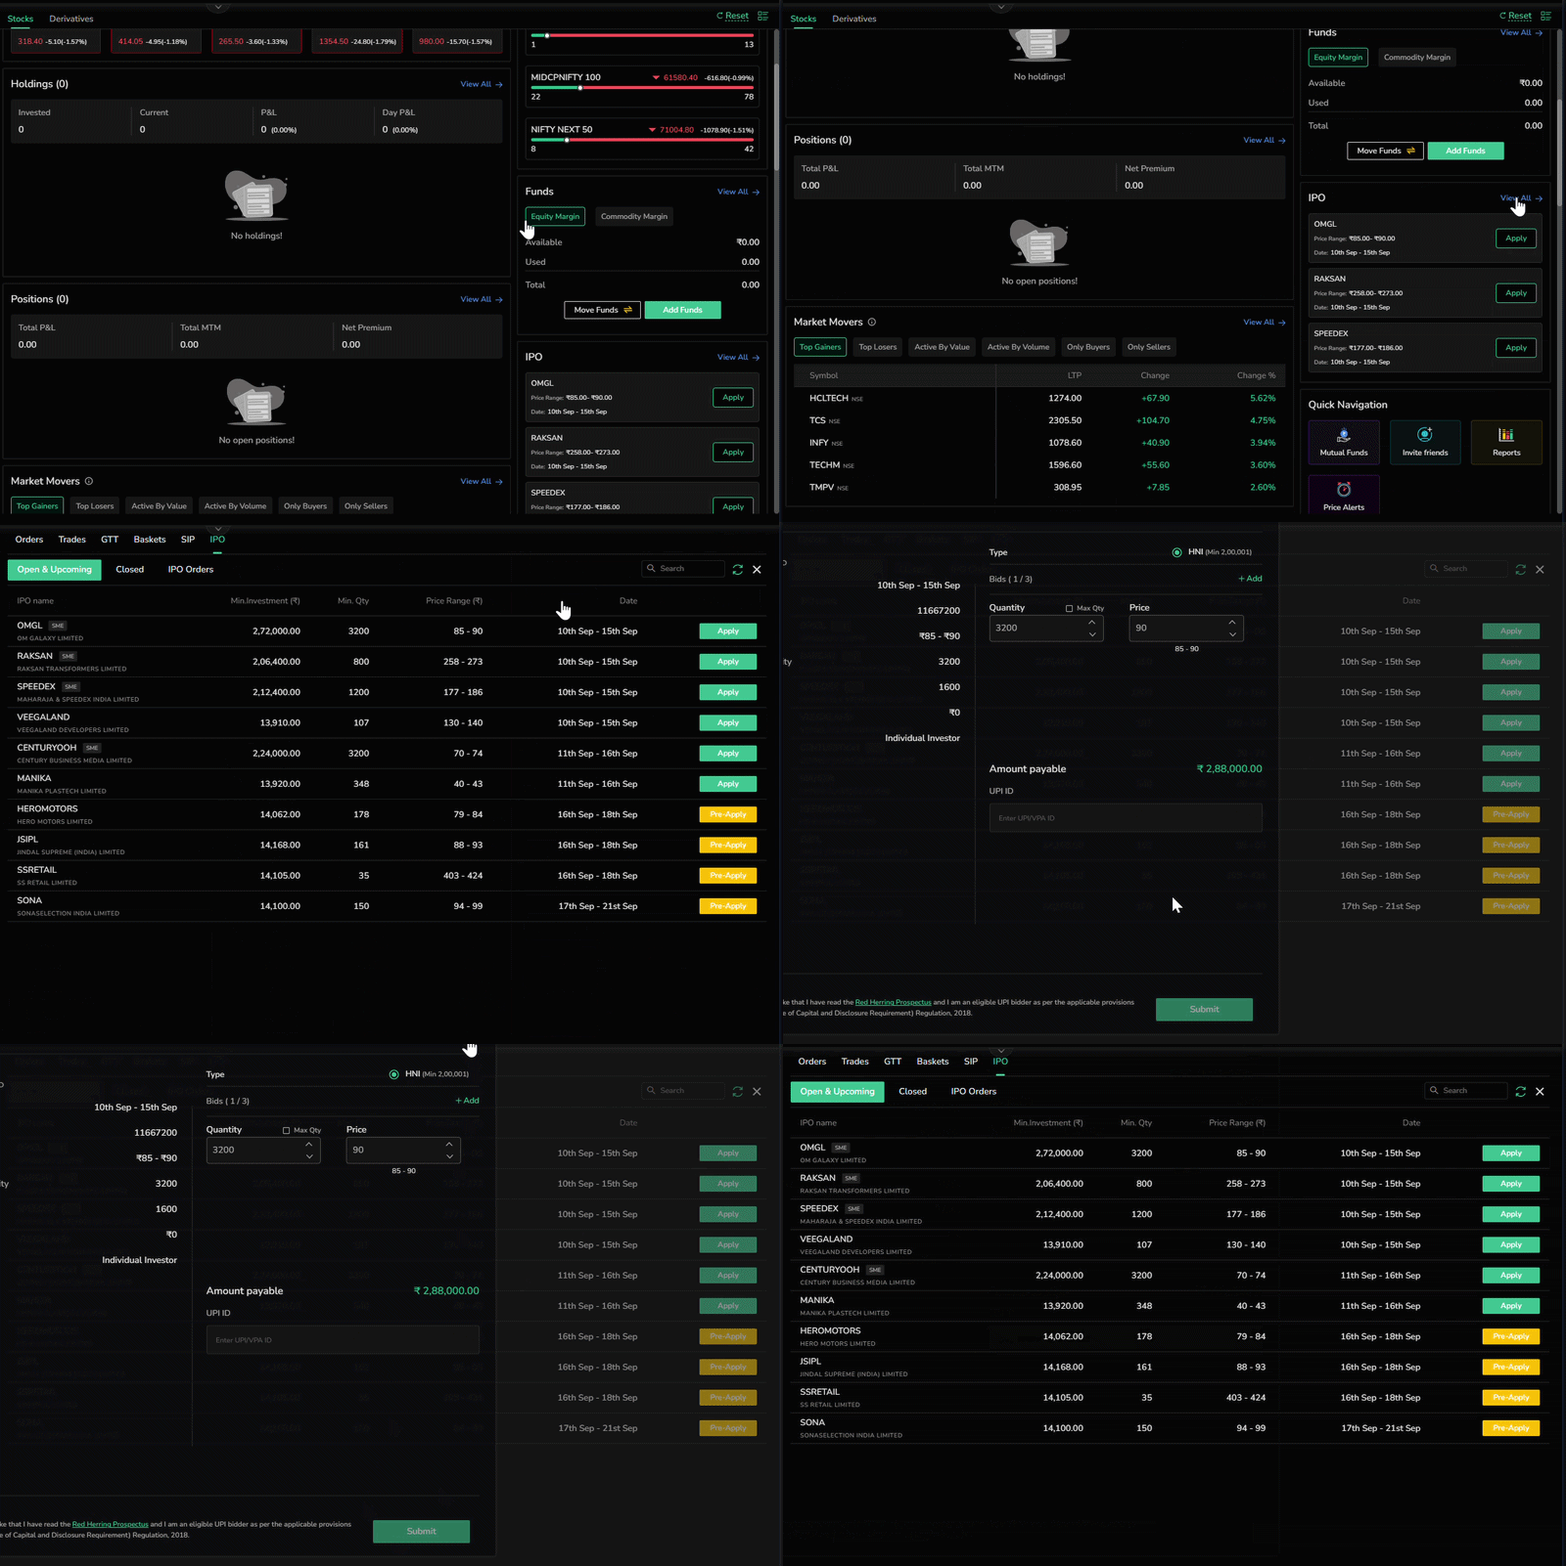
The IPO widget provides quick access to ongoing IPOs, including the price range and application dates.
- Click View All to view the complete list of available IPOs.
- Click Apply to open the IPO application form on CubePlus.
- Review the issue details, enter the UPI ID, accept the declaration and submit the application.
- Use IPO Orders to view completed, cancelled and pending applications.
ETFs
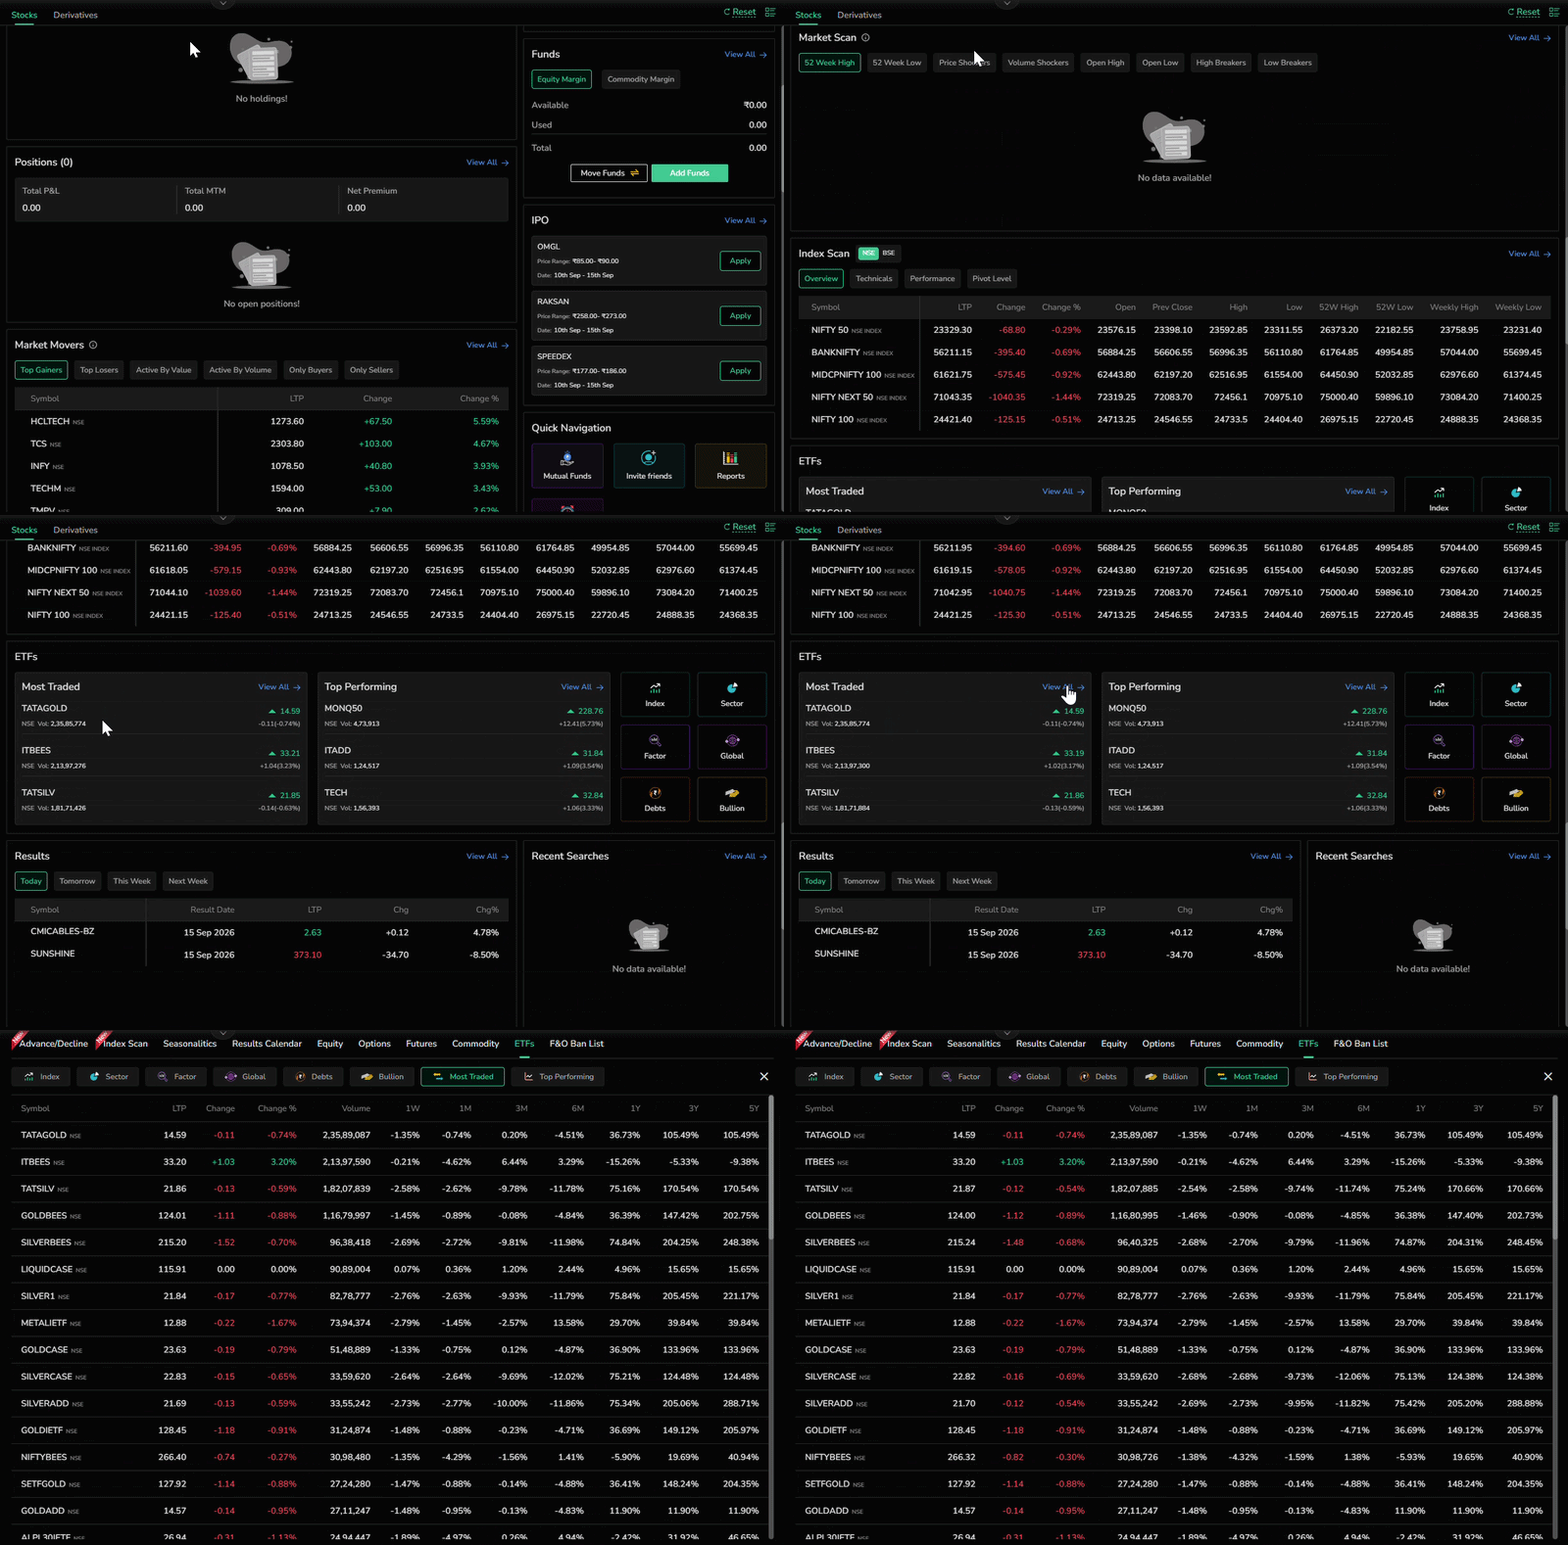
The ETF section provides a structured view of ETFs by category and performance.
- Index
- Sector
- Factor
- Global
- Debts
- Bullion
Most Traded ranks ETFs by trading activity, while Top Performing ranks them by price performance. ETF rows show returns across periods from 1 week to 5 years.
Trading Tools
The Trading Tools widget provides quick access to frequently used CubePlus tools.
- Chart Terminal – open the full charting workspace.
- Scalper Mode – access the fast intraday trading interface.
- Option Terminal – open the options trading interface.
- GTT – place Good Till Triggered conditional orders.
- NxtOption – access options strategy building, simulation and volatility analysis.
- Decade View – view long-term company financials and performance.
Customize the Stocks Dashboard
CubePlus Web now has a new dashboard experience. Earlier, the dashboard was a single page without widgets. Now, you can use customizable widgets and arrange or move them around based on your preferences. The dashboard is built around two dedicated tabs: Stocks and Derivatives.
The available widgets include Top Stocks, Advance/Decline, Holdings, Funds, Positions, IPO, Market Movers, Quick Navigation, Trading Tools, Market Scan, Index Scan, ETFs, Results and Recent Searches.
Turn Widgets On or Off
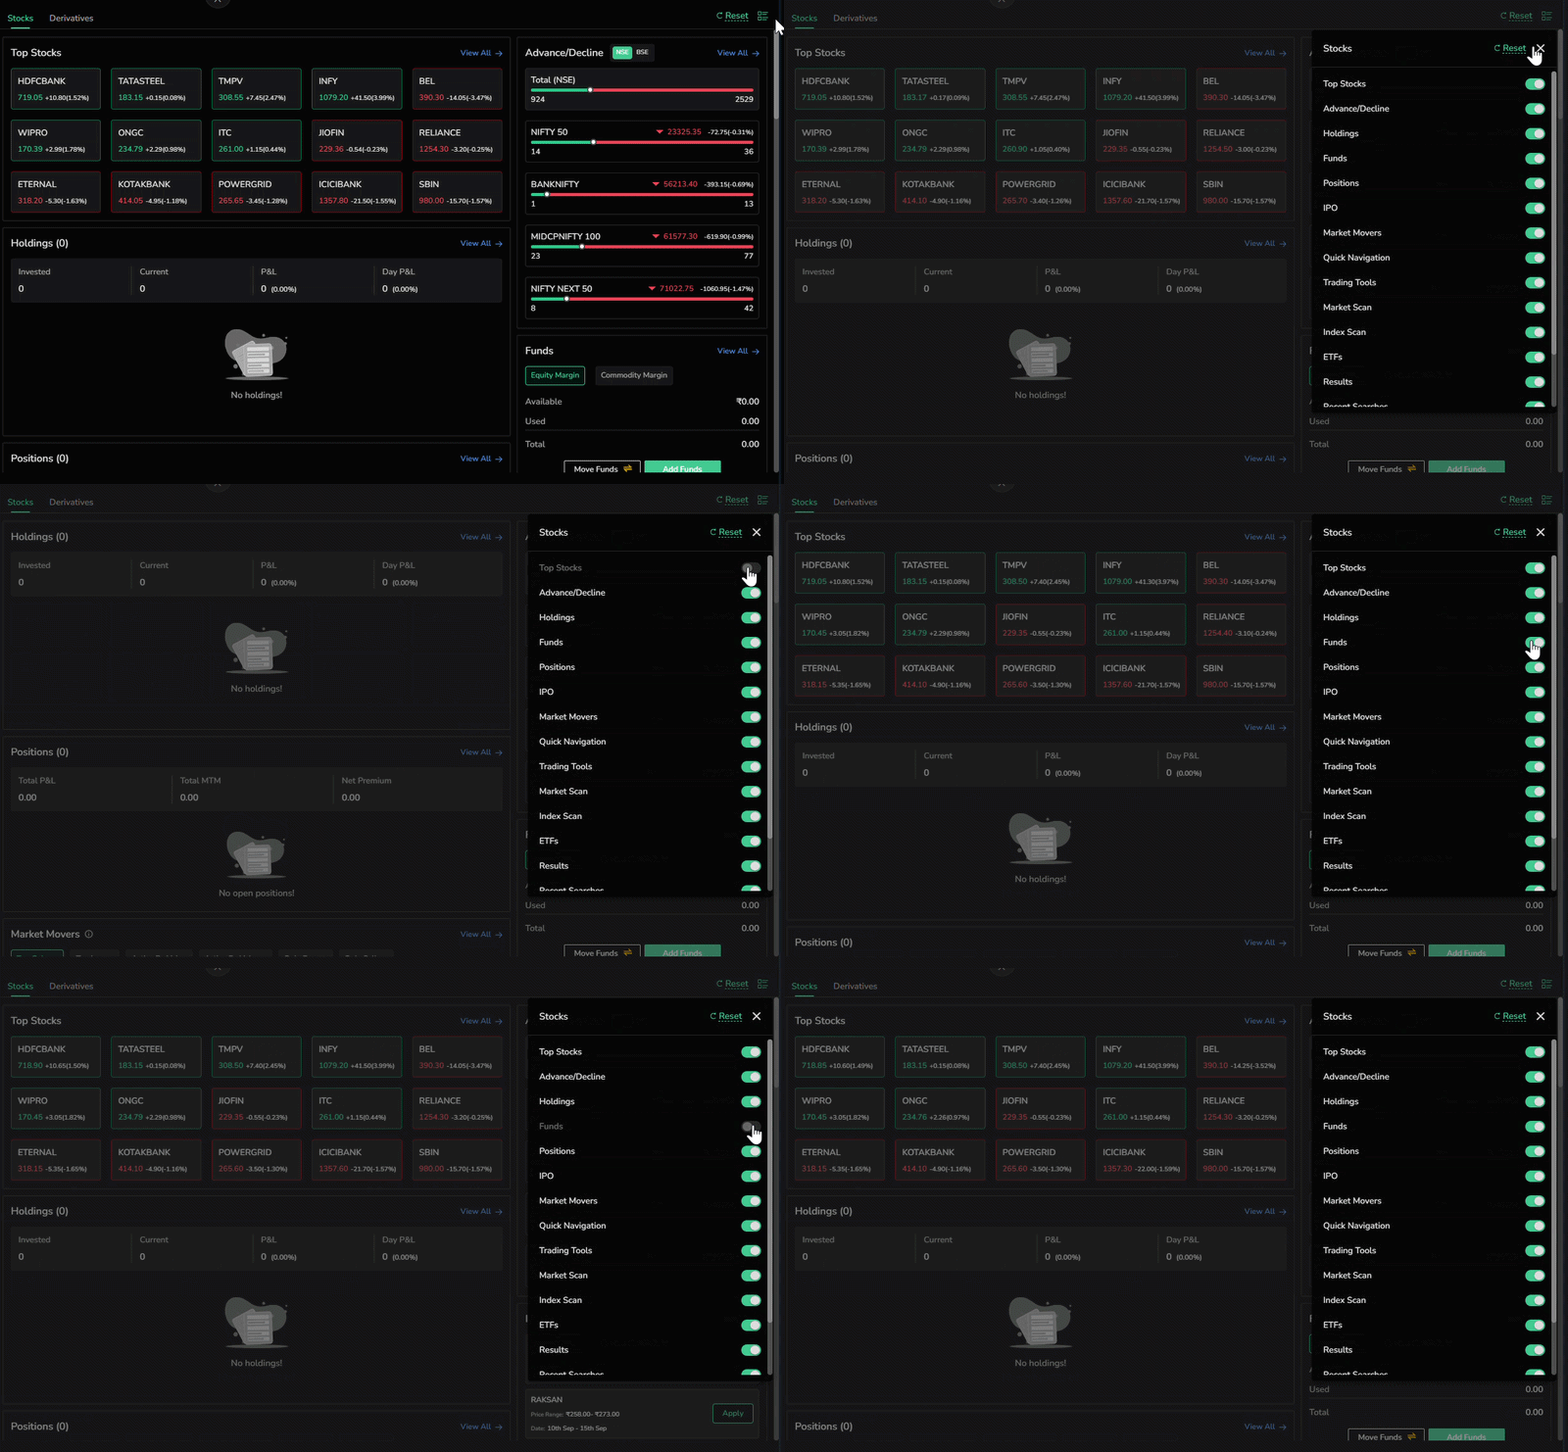
- Open the Dashboard settings.
- Use the toggle next to a widget to show or hide it.
Resize Widgets
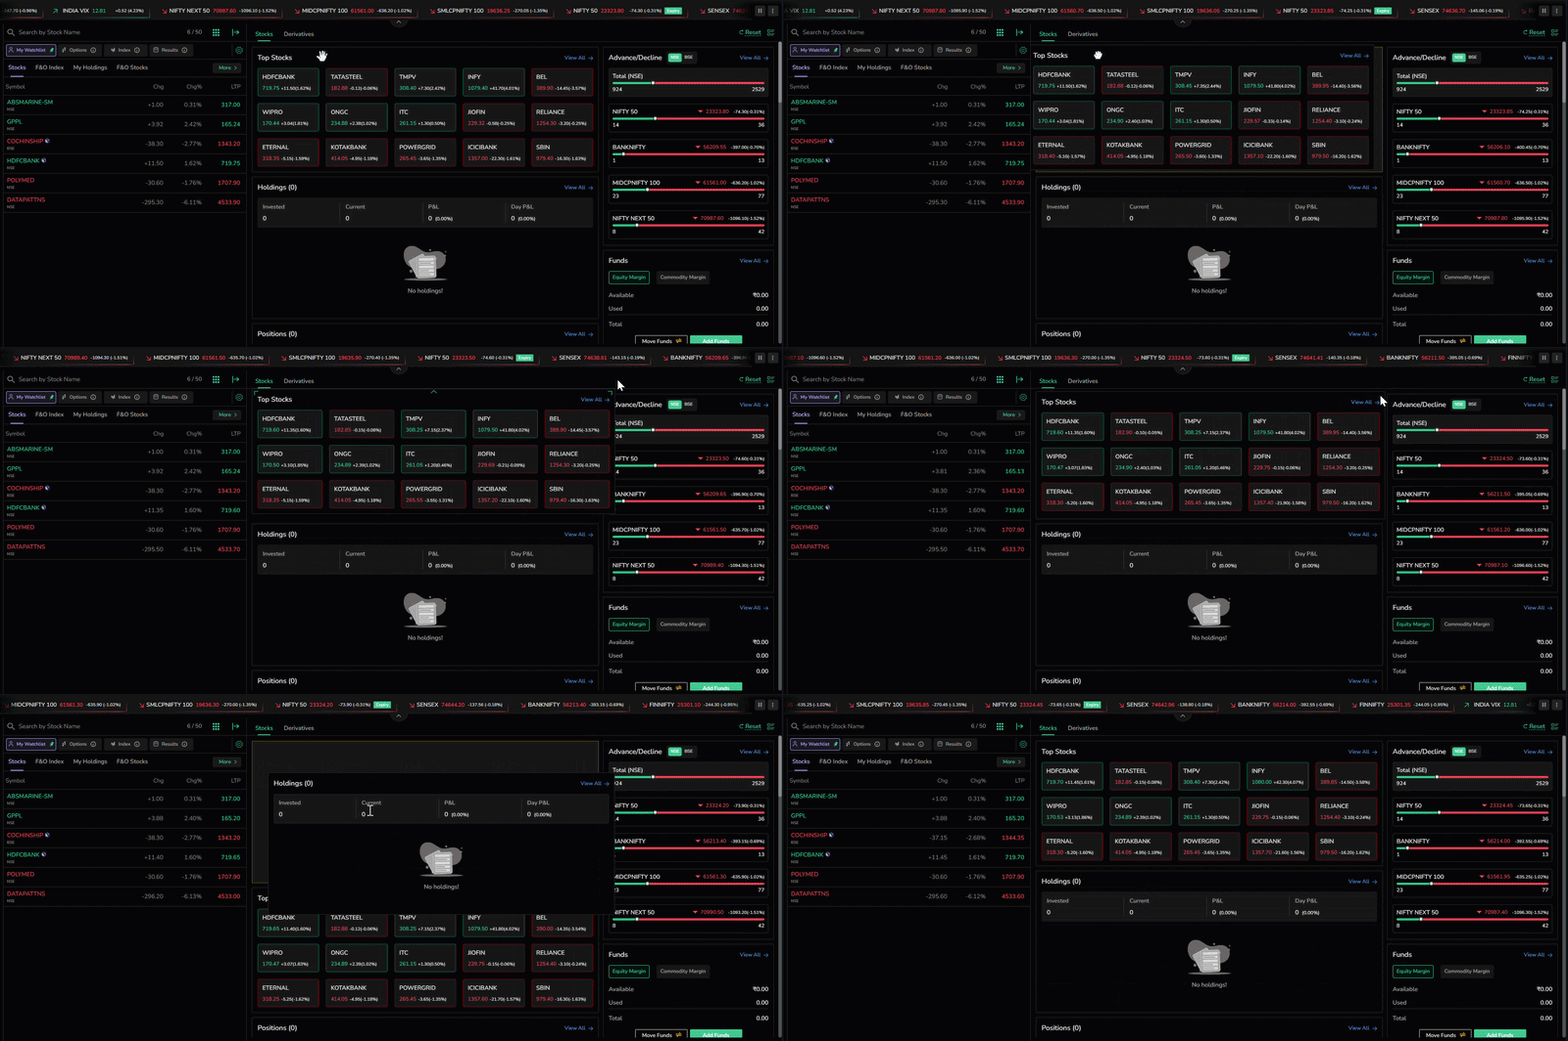
Resize widgets to give more space to the sections you use frequently and keep less-used sections compact.
Reorder Widgets
Drag widgets using the handle on the card to change their order.
Reset the Layout
Click Reset to restore the default Dashboard layout.
Derivatives
The Derivatives tab provides a consolidated view of futures and options market activity. It brings together actively traded index and stock options, derivatives market scans, Open Interest analysis, rollover information, option-chain access and derivatives trading tools.
On the Web
- Log in to CubePlus Web.
- Click Dashboard from the main menu.
- Select the Derivatives tab.
Top Traded Index Options
The Top Traded Index Options section displays actively traded index option contracts. Each contract card shows the underlying index, expiry, strike, option type, LTP, price change and percentage change.
Click View All to open the detailed Index Options view.
Top Traded Stock Options
The Top Traded Stock Options section displays actively traded stock option contracts. Each card shows the stock symbol, expiry, strike, option type, LTP and price movement.
Click View All to open the detailed Stock Options view.
View All – Index and Stock Options
The detailed options view provides market-activity scans for index and stock options. Use the instrument selector to switch between Index and Stocks.
- Top Gainers
- Top Losers
- Active By Volume
- Active By Value
- OI Gainers
- OI Losers
- Rollover Analysis
- OI Analysis
Use the segment and expiry selectors to narrow the results. For Index options, select the required underlying such as NIFTY 50, BANKNIFTY or FINNIFTY. For Stock options, select Stocks to view individual stock option contracts.
The detailed table displays market information such as Symbol, LTP, Change, Change %, Open Interest, OI Change %, Volume and Value.
Quick Navigation
The Quick Navigation section provides shortcuts to frequently used derivatives features.
- Option Chain (NIFTY) – opens the NIFTY option chain.
- GTT – opens the Good Till Triggered order feature.
- Results Calendar (F&O) – opens the F&O results calendar.
- Alerts – opens market alerts.
- F&O Ban List – opens the F&O Ban List.
Funds
The Funds section provides a quick view of trading funds. Use the Equity Margin and Commodity Margin tabs to switch between the available margin views. The section displays Available, Used and Total funds.
Use Move Funds to transfer available funds and Add Funds to add funds to the trading account. Click View All for the detailed Funds view.
Positions
The Positions section provides a summary of open derivatives positions and displays Total P&L, Total MTM and Net Premium. Click View All to open the complete Positions view.
Results
The Results section provides access to the corporate results calendar relevant to F&O stocks. Use Yesterday, Today, This Week or Next Week to select the required period. Click View All for the detailed Results Calendar.
Option Chain
The Option Chain section provides a quick view of the option chain from the Dashboard. Select NIFTY 50, SENSEX, BANKNIFTY or FINNIFTY and choose the required expiry.
The chain displays Call and Put information around the strike prices, including Open Interest, OI change, Delta and LTP. The underlying's current market value and movement are displayed between the Call and Put sections.
Click View All to open the full Option Chain.
Market Scan
Market Scan helps identify significant activity across futures and options. Select NFO or BFO and use the available scans.
- Top Gainers
- Top Losers
- Active By Volume
- OI Gainers
- OI Losers
Use the instrument selector and expiry selector to narrow the results. The table displays Symbol, LTP, Change, Change %, Volume and Value.
Trading Tools
The Trading Tools section provides quick access to derivatives trading and analysis tools.
- Easy Option
- Advanced Option Chain
- Simulator
- IVR-VP Scan
- IV Charts
- OI Spurs
- PCR Chart
- Straddle Chain
- One Tap
- Scalper Mode
These tools provide access to option analysis, volatility analysis, Open Interest analysis, strategy simulation and faster trading workflows.
OI Analysis
OI Analysis helps identify changes in Open Interest along with price movement in futures contracts. Select NFO or BFO and choose the required expiry.
- Long BuildUp
- Long Unwinding
- Short BuildUp
- Short Covering
The table displays Symbol, LTP, Change, Change %, Volume and Value. Use the categories to identify the type of position-building or unwinding taking place in the selected contracts.
Top F&O Stocks
Top F&O Stocks provides a quick view of stocks showing significant activity in the F&O segment.
- Top Gainers
- Top Losers
- Active By Value
- Active By Volume
- Only Buyers
- Only Sellers
The table displays Symbol, LTP, Change and Change %. Click View All to open the detailed F&O stock view.
Rollover Analysis
Rollover Analysis helps identify contracts with the highest or lowest rollover activity. Use Highest or Lowest to switch between the categories.
Each contract displays the symbol, expiry, R % (rollover percentage) and Cost. Click View All to open the detailed Rollover Analysis.
Recent Searches
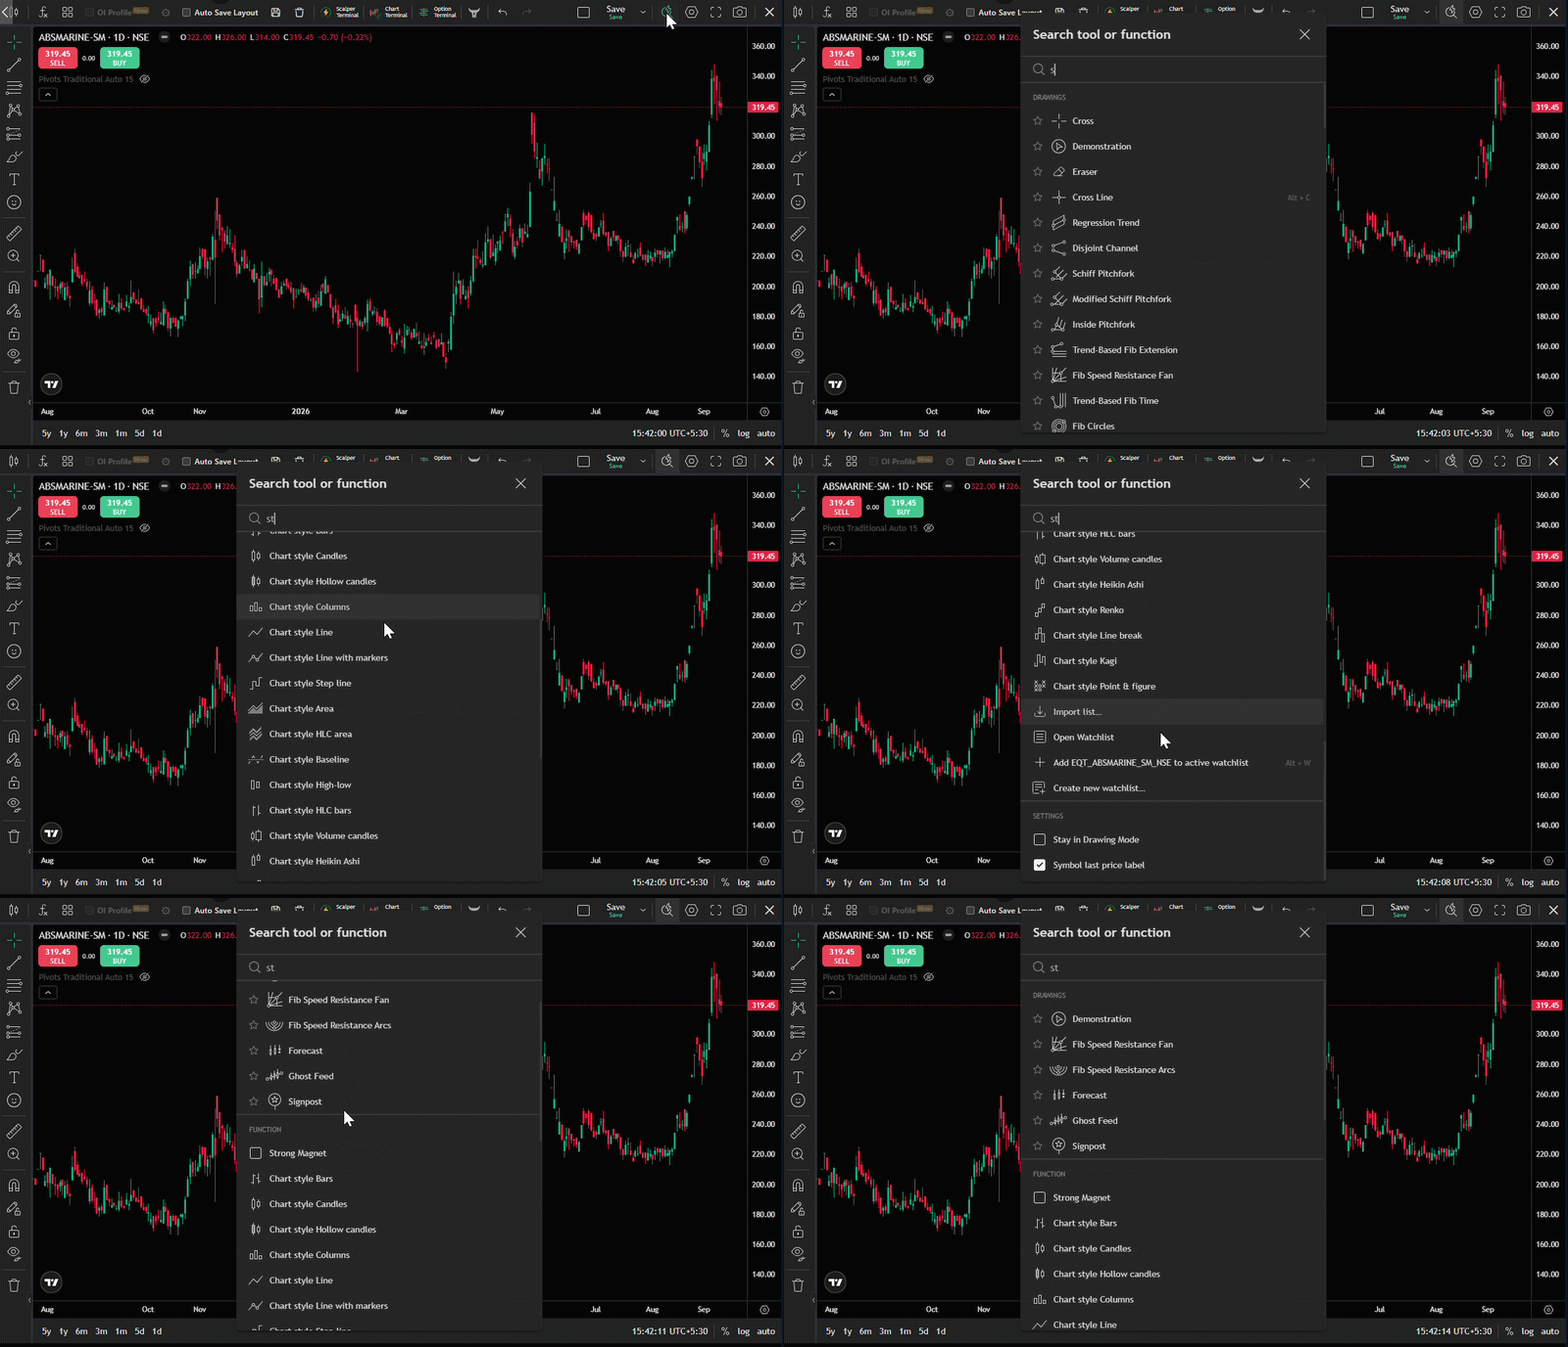
Recent Searches displays instruments that you have recently searched for on CubePlus. Each card shows the instrument name and available market information. Click View All to view the complete list.
F&O Ban List
The F&O Ban List displays stocks currently placed under the F&O ban. The table provides Symbol, LTP, Change, Change %, Value and Volume. Click View All to open the detailed F&O Ban List.
Dashboard Customisation
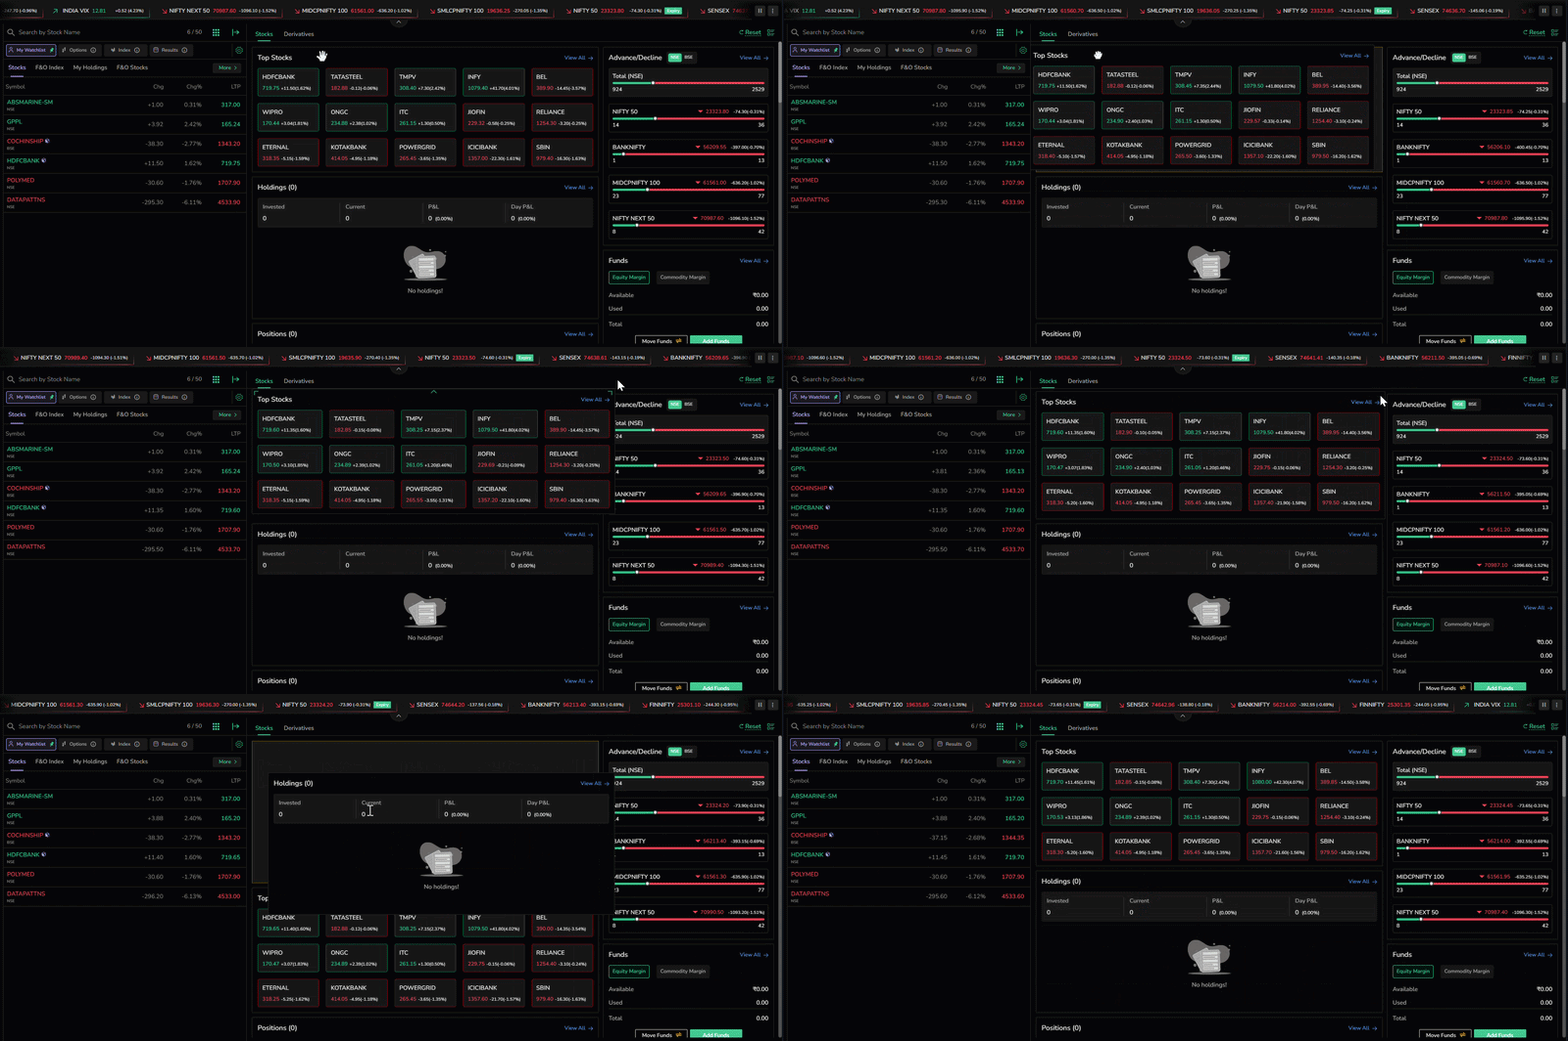
The Dashboard can be customised to suit your trading workflow. Use the Dashboard settings to change theme, language, order preference, products, order types and many more. You can also use customizable widgets and arrange or move them around based on your preferences.
For derivatives trading, you can prioritise sections such as Option Chain, Market Scan, OI Analysis and Rollover Analysis while keeping less-used sections lower on the Dashboard.